Azure Monitor Must Become Your AI Decision Fabric
Turning Azure Monitor into an AI-Era Observability Fabric

Dashboards are losing the AI era. AI workloads do not just generate more telemetry. They expose how fragile dashboard-first monitoring becomes when incidents span models, apps, data platforms, identity, and human workflows.
Here is the opinionated version: Azure Monitor should stop being treated like a standalone monitoring tool and start being designed as the backbone of an observability fabric. Not a prettier pane of glass. A cross-domain telemetry layer that preserves context across Azure services, Microsoft 365 surfaces, Power Platform workflows, and data platforms so operators can act on incidents instead of narrating them after the fact.
Azure Monitor already supports key observability functions today. My argument is about the strategic opportunity: design it as the shared operational plane across AI, app, data, and workflow domains rather than treating it as a destination for charts and alerts.
That position is not a branding exercise. It lines up with how Microsoft already frames architecture. Azure Architecture Center organizes solutions around patterns, reference architectures, and decision guides. Azure’s Well-Architected Framework treats operational excellence, reliability, security, and cost as design concerns, not afterthoughts. Telemetry belongs inside those decisions from day one, especially for AI systems that fail across multiple layers at once.
The dashboard era is ending
The old model was simple: collect logs, chart CPU, wire alerts, build a NOC wallboard, and call it “observability.” AI makes the limits of that model impossible to ignore.
When an AI-powered workflow degrades, the blast radius is rarely isolated. A single bad customer experience can involve prompt construction, API gateway latency, retrieval quality, model response delay, token consumption spikes, downstream business logic, data platform throttling, identity policy friction, and a human approval step in a Power Platform flow. A dashboard can show symptoms. It cannot reliably explain causality across that chain unless the underlying telemetry is correlated.
In March, a 14-person product engineering team I advised spent two days blaming an Azure OpenAI latency issue before trace data showed the real bottleneck was a retrieval stage issuing duplicate queries after an identity token refresh edge case. That is the AI-era monitoring problem in one sentence: the visible symptom and the actual fault domain are often different.
This is why observability has to be treated as an architectural capability. The goal is not more charts. The goal is faster, more trustworthy decisions under uncertainty.
Why Azure Monitor matters more, not less
Some teams react to this complexity by assuming they need to replace Azure Monitor with a new “AI observability” category. I think that is the wrong move.
Azure AI architecture guidance already places Application Insights and Azure Monitor in recommended AI monitoring paths. That matters. Microsoft’s own AI reference architectures do not treat observability as an add-on bolted to the side after the model ships. They treat it as part of the workload path itself.
The strategic shift is not about one magical feature. It is about Azure Monitor serving as the correlation backbone for metrics, logs, traces, exceptions, and operational events.
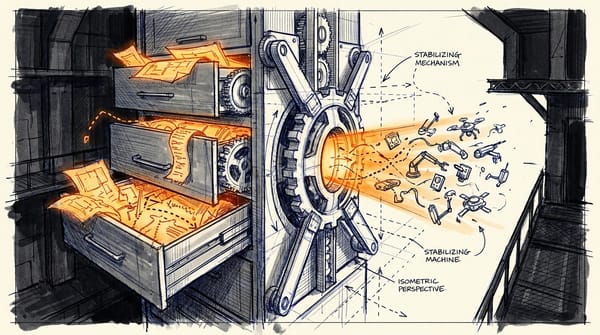
A simple way to visualize that backbone is to map telemetry collection directly onto the AI request path:

What to observe: every stage emits into a shared operational plane, and that plane can then feed governance, cost, and reliability reviews instead of just real-time dashboards.
Exemplars and trace correlation are now foundational
Aggregate metrics are useful, but they are not sufficient for AI systems. A p95 latency spike tells you something is wrong. It does not tell you whether the cause was a larger prompt, a degraded retrieval index, a slow downstream dependency, a retry storm, or a model-side timeout.
That is why exemplars and trace correlation matter so much. Operators need a path from “the metric moved” to “show me the request path that explains it.” Exemplar support and trace-to-metric workflows can vary by tooling surface, but the operational requirement is the same.
The following examples are OpenTelemetry-style patterns that illustrate correlation design, with Azure-native export and schema choices to be adapted per environment.
Start by propagating correlation context across the full AI request path. This illustrative Python example uses OpenTelemetry baggage and span attributes to carry business and tenant context from the front door through retrieval and model invocation:
# Propagate correlation context with custom attributes across an AI request path
from opentelemetry import trace, baggage
from opentelemetry.sdk.trace import TracerProvider
from opentelemetry.sdk.trace.export import BatchSpanProcessor, ConsoleSpanExporter

trace.set_tracer_provider(TracerProvider())
trace.get_tracer_provider().add_span_processor(BatchSpanProcessor(ConsoleSpanExporter()))
tracer = trace.get_tracer("ai-observability-fabric")

ctx = baggage.set_baggage("business.transaction_id", "txn-48291")
ctx = baggage.set_baggage("tenant.id", "contoso", context=ctx)

with tracer.start_as_current_span("http.request", context=ctx) as span:
    span.set_attribute("enduser.id", "user-123")
    span.set_attribute("ai.operation.name", "customer-support-answer")
    with tracer.start_as_current_span("retrieval.stage") as retrieval:
        retrieval.set_attribute("ai.retrieval.index", "kb-prod")
        retrieval.set_attribute("ai.retrieval.top_k", 5)
    with tracer.start_as_current_span("model.invocation") as model:
        model.set_attribute("ai.model.name", "gpt-4o-mini")
        model.set_attribute("ai.model.provider", "azure-openai")
        model.set_attribute("business.transaction_id", "txn-48291")
What to observe: the example deliberately tags both technical and business context. In Azure environments, baggage and custom span attributes alone do not automatically produce first-class correlation outcomes. Teams still need consistent instrumentation, exporters, and schema conventions across services.
Then emit structured logs that align with those traces instead of creating a second, disconnected evidence stream:
# Emit structured logs that align traces, model metadata, and business identifiers
import logging

logging.basicConfig(level=logging.INFO, format="%(message)s")
logger = logging.getLogger("ai-app")

record = {
    "message": "LLM response generated",
    "trace_id": "4bf92f3577b34da6a3ce929d0e0e4736",
    "span_id": "00f067aa0ba902b7",
    "business_transaction_id": "txn-48291",
    "retrieval_index": "kb-prod",
    "model_name": "gpt-4o-mini",
    "prompt_tokens": 812,
    "completion_tokens": 146,
}
logger.info(record)
What to observe: trace IDs, span IDs, model metadata, and token counts should line up with the same request narrative. If your logs and traces cannot be joined by design, your incident review will devolve into guesswork.
Cross-domain telemetry is the real platform shift
The biggest change is not inside Azure Monitor alone. It is the surrounding platform context.
Legacy monitoring assumed stack boundaries: infrastructure here, apps there, data somewhere else, collaboration tools somewhere else again. That separation breaks down in AI operations. A production incident can begin in an application, surface in Teams, require a human approval in Power Automate, depend on identity policies, and need historical analysis in a data platform. The telemetry model cannot stop at the Azure resource boundary if the business process does not stop there.
This is why the broader Microsoft platform direction matters. Microsoft Fabric is documented as a unified platform for data and analytics. Fabric training emphasizes end-to-end analytics in one platform with AI support. Fabric data agent concepts describe conversational Q&A over enterprise data using generative AI. Fabric IQ is positioned as part of an enterprise intelligence layer across the Microsoft stack.
My reading of these platform moves is that telemetry is no longer just an operations exhaust stream. It is becoming enterprise data that must be queried, governed, analyzed, and operationalized across domains.
My view is straightforward: Azure Monitor should remain the operational control plane, while platforms like Fabric become important destinations for broader analytics, long-horizon pattern analysis, and business correlation. That division of labor is stronger than trying to force every telemetry use case into one UI.
What this means today in practice
- Instrument end-to-end traces across the full AI request path, including retrieval, model invocation, downstream dependencies, and exception handling.
- Standardize business context tags such as tenant, transaction, operation, and impact labels so telemetry can be joined across teams.
- Define hot, warm, and cold telemetry destinations so operational triage, analytics, and compliance retention are handled intentionally.
Cost, retention, and governance are architecture decisions
AI systems produce high-volume, high-cardinality telemetry. Retries, streaming responses, background agents, and probabilistic failure modes can explode both data volume and noise. That makes cost and retention first-order architecture decisions.
Retention depth, sampling strategy, workspace design, and data routing should be explicit design choices reviewed alongside reliability and security.
A practical governance step is to audit diagnostic settings and workspace posture across resources. As always with Azure administration examples, Az module versions and resource coverage evolve, so validate commands against your current environment.
# Query diagnostic settings and retention posture across Azure resources for governance reviews
Connect-AzAccount | Out-Null

$resources = Get-AzResource
$report = foreach ($r in $resources) {
    $diag = Get-AzDiagnosticSetting -ResourceId $r.ResourceId -ErrorAction SilentlyContinue
    [pscustomobject]@{
        Name                = $r.Name
        Type                = $r.ResourceType
        ResourceGroup       = $r.ResourceGroupName
        HasDiagnosticConfig = [bool]$diag
        WorkspaceId         = ($diag.WorkspaceId -join ";")
        LogsEnabled         = ($diag.Logs | Where-Object Enabled).Count
        MetricsEnabled      = ($diag.Metrics | Where-Object Enabled).Count
    }
}

$report | Sort-Object Type, Name | Format-Table -AutoSize
What to observe: this kind of report quickly shows which resources are not sending diagnostics anywhere useful, and where logging and metrics coverage are inconsistent.
Then validate retention and quota settings in Log Analytics workspaces:
# Validate Log Analytics workspace retention settings to support cost and compliance checks
Connect-AzAccount | Out-Null

$workspaces = Get-AzOperationalInsightsWorkspace
$workspaces |
    Select-Object Name, ResourceGroupName, Location,
        @{Name="RetentionInDays";Expression={$_.RetentionInDays}},
        @{Name="Sku";Expression={$_.Sku.Name}},
        @{Name="DailyQuotaGb";Expression={$_.WorkspaceCapping.DailyQuotaGb}} |
    Sort-Object RetentionInDays -Descending |
    Format-Table -AutoSize
What to observe: retention, SKU, and daily quota are not administrative trivia. They directly affect forensic depth, compliance posture, and spend predictability.
The next operating model is AI-assisted, not dashboard-assisted
The strongest evidence that this shift is real is operational.
Azure SRE Agent is explicitly presented as an AI-driven platform that connects observability tools, incident platforms, and source code repositories to automate operational workflows. That validates the direction of travel: from passive monitoring toward action-oriented systems that can help investigate, correlate, and accelerate remediation.
That only works if the telemetry underneath is trustworthy.
Here is a minimal example of how exception telemetry becomes more valuable when it carries business impact context:
# Correlate a failed retrieval or model call with exception telemetry and business impact tags
from opentelemetry import trace
from opentelemetry.sdk.trace import TracerProvider

trace.set_tracer_provider(TracerProvider())
tracer = trace.get_tracer("ai-failures")

try:
    with tracer.start_as_current_span("model.invocation") as span:
        span.set_attribute("ai.model.name", "gpt-4o-mini")
        span.set_attribute("business.transaction_id", "txn-48291")
        span.set_attribute("order.id", "SO-10045")
        raise TimeoutError("Upstream model latency exceeded SLA")
except Exception as ex:
    with tracer.start_as_current_span("error.handler") as err:
        err.record_exception(ex)
        err.set_attribute("error.type", type(ex).__name__)
        err.set_attribute("business.impact", "checkout-delay")
What to observe: the exception is not just a timeout. It is tied to a transaction and an impact label. That is the difference between technical noise and operationally useful evidence.
What platform leaders should do next
If you lead platform engineering, SRE, cloud architecture, or enterprise data, here is the practical move:
Treat telemetry as a product.
That means standards, owners, quality gates, lifecycle management, and explicit consumers. It means defining telemetry contracts for AI services before launch. It means prioritizing end-to-end trace correlation, consistent business context, and intentional routing before funding another dashboard refresh. It means deciding what stays hot in Azure Monitor, what moves into broader analytics platforms like Fabric, and what gets retained for compliance or forensics.
My thesis is simple: Azure Monitor is most valuable in the AI era when it is designed as the backbone of an observability fabric, not when it is treated as a standalone monitoring destination.
In your environment, what breaks first: trace correlation, retention economics, or ownership?
#Azuremonitor #SRE #MicrosoftFabric
Sources & References
- Azure Architecture Center - Azure Architecture Center
- Microsoft Fabric documentation - Microsoft Fabric
- Azure Well-Architected Framework - Microsoft Azure Well-Architected Framework
- AI Architecture Design - Azure Architecture Center
- Microsoft Certified: Azure AI Cloud Developer Associate (beta) - Certifications
- Fabric data agent creation - Microsoft Fabric
- What is Fabric IQ? - Microsoft Fabric
- Introduction to end-to-end analytics using Microsoft Fabric - Training
- Overview of Azure SRE Agent
- Microsoft Certified: SQL AI Developer Associate - Certifications
Try it yourself
Run this tutorial as a Jupyter notebook: Download runbook.ipynb (23 cells, 21 KB).