Detail the architecture, performance gains, and operational considerations for loading large model weights directly into GPU memory.
Detail the architecture, performance gains, and operational considerations for loading large model weights directly into GPU memory.

Cold starts are now a GPU tax, not just a latency bug.
When every GPU minute is expensive, cold starts stop being a nuisance and become a budget line item. The practical question is no longer just where model weights live, but how fast you can move them onto the node and into usable GPU memory with the fewest avoidable copies.
That distinction matters. In most Azure production paths, this is not literal storage-to-VRAM zero-copy. There is often still framework-managed deserialization, pinned host memory, checksum validation, or other runtime staging in the loop. The real win is a GPU-oriented, reduced-copy loading path that removes slow intermediate persistence and shortens time-to-first-token.
A recent Azure inference exercise made that painfully clear.
The workload was a bursty internal LLM service running in East US on AKS GPU nodes, scaled down aggressively outside business hours. The model was a 7B-class instruct checkpoint, stored as 16 safetensors shards totaling about 28 GB. Test nodes used a single NVIDIA A100 80 GB GPU per pod, with Azure Blob Storage as the durable artifact source and local NVMe enabled as a cache tier. The baseline used image-packaged weights plus local-disk reads on node start; the revised path fetched shards from Blob and loaded them through a more GPU-oriented runtime path with pinned-host fallback when needed. Reported timings below are medians across repeated cold starts in a controlled test window, with first-token latency measured from artifact fetch start.
In that setup, the service spent 9.1 seconds from artifact fetch start to first token on the baseline path, versus 4.8 seconds after redesigning startup around remote artifact delivery and a reduced-copy GPU-oriented load path. That is a 47.3% reduction in cold-start time. On an autoscaled fleet, that translated into less paid idle GPU time before serving began.
The thesis is simple: for GPU-backed LLM inference on Azure, remote artifact delivery plus a GPU-oriented loading path can reduce cold-start penalties versus slower local-disk paths or image-packaged artifacts, but only if you optimize the whole path end to end: storage throughput, network bandwidth, host-memory staging, VRAM fit, and observability.
The situation: startup time became a cost problem
The team’s original architecture was common because it was operationally easy:
- Store model weights on node-local disk or bake them into the container image
- Start the inference process
- Read weights into system RAM
- Copy weights into GPU memory
- Warm the model
- Serve requests
That pattern works until scale behavior changes.
If your fleet is always warm, startup is amortized. If your fleet scales to zero, rolls frequently, or replaces nodes during maintenance, startup becomes a recurring tax. Microsoft’s guidance for Ollama on GPU servers is explicit here: model files are read from disk and copied into system RAM at startup, so faster NVMe materially improves load time because storage is on the critical path, not a side detail.
The team learned this during a 14-node soak test for a customer-support copilot. A maintenance event invalidated the local cache tier, replacement nodes came up cold, and the same slow startup sequence repeated across the fleet within minutes.
The key realization was that cold start was not just an application metric. It was also:
- Unproductive GPU time
- Delayed autoscale response
- Lower request capacity during demand spikes
- More pressure to keep idle nodes warm just in case
That is why this pattern matters now. Startup itself has become an optimization target.

The root cause: the “direct to GPU” problem is really a path problem
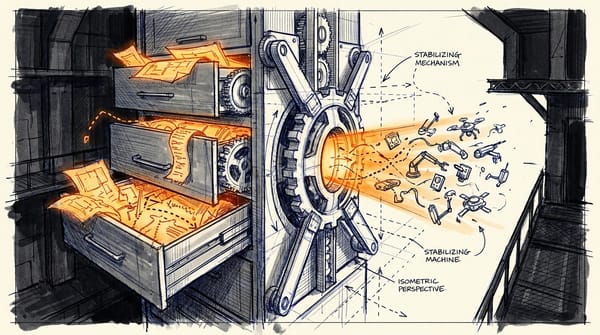
A lot of teams talk about “loading directly into GPU memory” as if it is a binary capability. In real systems, it is a path optimization problem.
Here is the architecture the team mapped before changing anything:

What this should make obvious is that the model-loading path has multiple choke points before inference begins. Even when people say “direct to GPU,” there is often still orchestration, deserialization, checksum validation, and sometimes host-side staging involved. The engineering win is not universal zero-copy. It is reducing redundant copies and avoiding slow intermediate persistence where the runtime allows it.
The baseline had three specific bottlenecks:
- Image pull and artifact locality
Large image-packaged weights made container pulls heavy and slow. Even if the image was cached, node replacement events often reset the advantage.
- Disk-to-RAM startup dependency
Microsoft’s Ollama guidance calls out that startup reads model files from disk into system RAM, which is exactly why storage class matters so much. Slow OS disks are a bad place to hide a 28 GB checkpoint, let alone a 70 GB one.
- VRAM fit assumptions
The team initially treated startup as a storage problem only. It was also a memory-fit problem. Azure Container Apps GPU guidance highlights the practical difference between T4 GPUs with 16 GB VRAM and A100 GPUs with 80 GB VRAM. That gap is decisive: if the model does not fit comfortably in VRAM, your loading strategy is constrained before performance tuning even starts. Azure guidance for Phi-3 similarly notes that even relatively efficient models need at least 16 GB of GPU memory, reinforcing that VRAM is the first gate, not the last one.
The decision: Blob-first artifacts, host-aware staging, GPU-oriented loading
The team chose a new target architecture:
- Keep model weights in Azure Blob Storage as the durable source of truth
- Stream artifacts over the network during startup
- Stage in host memory only when necessary
- Transfer into GPU VRAM as early as the runtime allows
- Use local NVMe as a cache tier, not as the canonical model store
That decision was less about elegance and more about operational economics.
Why Blob-first?
- Centralized artifact management
- No duplicate giant model bundles on every node image
- Better fit for elastic fleets and node churn
- Easier version control and rollback than repacking large images
Why not rely purely on local NVMe?
- It is excellent after warm-up
- It is fragile during node replacement, maintenance, and autoscale bursts
- It shifts operational complexity into cache management and state reconciliation
Why not package weights inside the image?
- Reproducible, yes
- But large images increase pull times and registry overhead
- The image becomes the bottleneck during scale-out
The loading sequence they implemented looked like this:

This sequence is illustrative rather than a literal Azure-native zero-copy implementation. In practice, the “direct GPU path” may still include framework/runtime-managed staging, pinned memory, decode steps, or tensor materialization before buffers are fully usable. The important distinction is whether you shorten the path and remove slow persistence layers, not whether every byte bypasses host involvement.
AKS GPU best practices matter here too. Startup performance is irrelevant if the driver stack, runtime, or device access is broken. A fast architecture on a misconfigured node is still a failed start.
The team also kept local NVMe enabled as a cache, but demoted it from source of truth to opportunistic acceleration layer. That turned out to be the right compromise.

The implementation: benchmark the phases, not just pod start time
One of the smartest things the team did was stop measuring “container ready” as the main metric.
They instrumented startup into explicit phases:
- Artifact fetch start
- Artifact fetch complete
- Host staging complete
- Model load complete
- First token time
Here is a simple benchmark pattern they used to compare strategies:
# Benchmark cold-start phases for comparing model loading strategies.
import time
from dataclasses import dataclass, asdict

@dataclass
class PhaseTimes:
    strategy: str
    artifact_fetch_start: float = 0.0
    artifact_fetch_end: float = 0.0
    host_staging_complete: float = 0.0
    model_load_complete: float = 0.0
    first_token_time: float = 0.0

def mark() -> float:
    return time.perf_counter()

def benchmark(strategy: str) -> dict:
    t = PhaseTimes(strategy=strategy, artifact_fetch_start=mark())
    time.sleep(0.05); t.artifact_fetch_end = mark()
    time.sleep(0.03 if strategy == "direct-gpu" else 0.12); t.host_staging_complete = mark()
    time.sleep(0.08 if strategy == "direct-gpu" else 0.20); t.model_load_complete = mark()
    time.sleep(0.02); t.first_token_time = mark()
    return asdict(t)

print(benchmark("host-staging"))
print(benchmark("direct-gpu"))
This is illustrative pseudo-code. The sleep calls simulate phases; production implementations should emit real timestamps from the loader, storage client, and inference runtime. The point is the measurement model. If you only track pod start time, you cannot tell whether the delay came from image pull, Blob fetch, host staging, GPU transfer, or model warm-up.
They then summarized the benchmark records to make the comparison obvious:
# Summarize phase durations and relative gains from benchmark records.
records = [
    {"strategy": "host-staging", "artifact_fetch_start": 0.0, "artifact_fetch_end": 1.2, "host_staging_complete": 3.8, "model_load_complete": 8.4, "first_token_time": 9.1},
    {"strategy": "direct-gpu", "artifact_fetch_start": 0.0, "artifact_fetch_end": 1.1, "host_staging_complete": 1.6, "model_load_complete": 4.2, "first_token_time": 4.8},
]

def duration(r, start, end):
    return round(r[end] - r[start], 3)

for r in records:
    print(r["strategy"], {
        "fetch_s": duration(r, "artifact_fetch_start", "artifact_fetch_end"),
        "stage_s": duration(r, "artifact_fetch_end", "host_staging_complete"),
        "load_s": duration(r, "host_staging_complete", "model_load_complete"),
        "ttft_s": duration(r, "model_load_complete", "first_token_time"),
        "cold_start_s": duration(r, "artifact_fetch_start", "first_token_time"),
    })

baseline = records[0]["first_token_time"]
improved = records[1]["first_token_time"]
print({"ttft_gain_pct": round((baseline - improved) / baseline * 100, 1)})
What to observe in the output:
- Baseline cold start: 9.1 seconds
- GPU-oriented reduced-copy path: 4.8 seconds
- Improvement: 47.3%
Those numbers came from a controlled environment, not a universal promise. In this case, the biggest savings came from reducing host staging and model load time, not from changing token generation behavior once the model was already resident.
For the actual loader, they used a shard-oriented pattern with direct GPU buffers when available and pinned host memory as a fallback:
# Stream model shards into preallocated GPU buffers with pinned-host fallback.
from typing import Iterable

def load_shards(shards: Iterable[str], direct_gpu: bool = True) -> None:
    for shard in shards:
        if direct_gpu:
            print(f"stream {shard} -> gpu_buffer")
        else:
            print(f"download {shard} -> pinned_host_buffer")
            print(f"copy pinned_host_buffer -> gpu_buffer")
    print("finalize tensor map and validate checksums")

if __name__ == "__main__":
    shard_list = ["model-00001.safetensors", "model-00002.safetensors"]
    load_shards(shard_list, direct_gpu=True)
Again, this is illustrative pseudo-code. The important pattern is that shard-based loading lets you control concurrency, validate checksums, and avoid unnecessary persistence to slower local media.
They also externalized startup tuning so the deployment team could change concurrency, warm-up behavior, and observability without rebuilding the service:
# Operational tuning values for throughput, startup safety, and observability.
model:
  format: safetensors
  shard_count: 16
  direct_gpu_load: true
startup:
  readiness_probe_initial_delay_seconds: 20
  warmup_prompt: "hello"
  fail_if_checksum_mismatch: true
storage:
  prefetch_concurrency: 8
  local_nvme_cache_enabled: true
observability:
  emit_phase_timings: true
  emit_gpu_memory_watermark: true
  emit_first_token_latency: true
What to do next if you are testing this pattern:
- Start with moderate prefetch concurrency
- Emit phase timings by default
- Record GPU memory watermark during load
- Fail fast on checksum mismatch rather than serving corrupted state

The results: where the gains showed up, and where they did not
The headline result was straightforward for this workload:
- Cold start to first token fell from 9.1 seconds to 4.8 seconds
- Relative improvement: 47.3%
- Absolute reduction: 4.3 seconds
The more operationally important outcomes were these:
1. Better GPU utilization during bursty scale-out
The service spent less paid time loading and more paid time serving. In bursty environments, that matters more than micro-optimizing token throughput on already-warm nodes.
2. Less sensitivity to image size
By keeping weights outside the container image, the team reduced image pull overhead and sped up rollout behavior during node churn.
3. Faster recovery after node replacement
With local NVMe as a cache rather than a dependency, startup remained within the measured 4.8-second median even when the cache was cold. That was not true in the old design.
4. Cleaner artifact management
Blob-first storage simplified model versioning and reduced duplicated storage across nodes.
That said, the gains were not universal.
On long-lived warm nodes, token generation speed did not change meaningfully, because startup optimization is not the same as inference kernel optimization. This post is about loading-path efficiency on Azure GPU inference, not about proving a new execution backend.
A compact way to think about the measured deltas:
| Metric | Baseline: image/local path | Revised: Blob-first GPU-oriented path |
|---|---|---|
| Model size | ~28 GB | ~28 GB |
| Shards | 16 | 16 |
| GPU | A100 80 GB | A100 80 GB |
| Artifact fetch | 1.2 s | 1.1 s |
| Host staging | 2.6 s | 0.5 s |
| Model load | 4.6 s | 2.6 s |
| First-token tail after load | 0.7 s | 0.6 s |
| Cold start total | 9.1 s | 4.8 s |
The pattern is the point: most of the gain came from cutting staging and load overhead, not from changing generation once the model was ready.
The trade-offs: the hard limits that decide whether this works
This pattern has real boundaries.
VRAM is the first gate
Azure’s GPU guidance makes this plain. A T4-class GPU has 16 GB VRAM; an A100-class GPU has 80 GB. That difference determines whether a model can fit fully in memory or whether you will be forced into offload, quantization, or sharding. Azure guidance for Phi-3 similarly points to 16 GB as a practical minimum even for relatively efficient models.
If the checkpoint does not fit with headroom, no startup trick fixes that.
The team added a startup guardrail for this exact reason:
# Guardrail checks for operational safety during direct GPU loading.
def validate_startup(free_gpu_gb: float, model_gb: float, checksum_ok: bool, network_ok: bool) -> bool:
    if not checksum_ok:
        raise RuntimeError("artifact checksum validation failed")
    if not network_ok:
        raise RuntimeError("storage endpoint unreachable")
    if free_gpu_gb < model_gb * 1.1:
        raise RuntimeError("insufficient GPU headroom for weights and allocator overhead")
    return True

print(validate_startup(
    free_gpu_gb=86.0,
    model_gb=70.0,
    checksum_ok=True,
    network_ok=True,
))
What to observe here is the explicit headroom check. Real deployments need room for allocator overhead, runtime buffers, and sometimes KV cache growth. “Fits on paper” is not enough.
Host RAM pressure still matters
Even with a GPU-first path, some staging may still happen. If the node is memory-tight, the loader can become unstable or slower than expected. That is a general systems constraint, not proof against the architecture.
Network can become the new bottleneck
Azure networking guidance for AI workloads matters because remote weight delivery is only as fast as the fabric beneath it. On weaker networking, Blob-first loading can simply move the bottleneck from disk to network.
Sharding changes the game
Once the model exceeds single-GPU memory, loading optimization is no longer the only problem. Azure Databricks documentation for FSDP is relevant here as an analogy for the next scaling regime: once the model no longer fits on one GPU, distributed memory strategies become necessary. At that point, a GPU-oriented loading path is still useful, but it is not sufficient.

The operational considerations: where production teams get surprised
The most common failure modes were not exotic.
Blob throughput and concurrent startup storms
If many nodes fetch the same model shards at once, storage throughput and request-rate ceilings can show up quickly. A single-node benchmark will not reveal this.
Cold cache spikes after maintenance
If you rely on local NVMe for acceleration, maintenance events and host replacement can wipe out your assumptions. That is exactly why the team kept Blob as the durable source and NVMe as opportunistic cache.
GPU memory fragmentation
A model may fit in theory and still fail in practice under allocator behavior or sidecar contention. This is especially common when multiple replicas share a node.
Missing observability
Too many teams stop at pod lifecycle events. You need startup-path observability, not just deployment observability.
What to log in production:
- Per-shard fetch latency
- Aggregate download throughput during startup
- GPU allocation failures and allocator retries
- Checksum failures or shard validation mismatches
- Local NVMe cache hit rate
- First-token latency p50 and p95
- Time spent in host staging vs GPU load
- GPU memory watermark during load and after warm-up
The team also validated node readiness before rollout with a simple preflight process:
# Validate Azure GPU node readiness before inference rollout.
$ErrorActionPreference = "Stop"
Write-Host "== GPU visibility =="
nvidia-smi --query-gpu=name,memory.total,driver_version --format=csv

Write-Host "== CUDA runtime =="
$cudaPath = $env:CUDA_PATH
if (-not $cudaPath) { Write-Warning "CUDA_PATH not set" } else { Write-Host "CUDA_PATH=$cudaPath" }

Write-Host "== NVMe / ephemeral disks =="
Get-PhysicalDisk | Select-Object FriendlyName, MediaType, Size, HealthStatus

Write-Host "== Network reachability =="
Test-NetConnection -ComputerName "storageaccount.blob.core.windows.net" -Port 443 | Out-Host

Write-Host "== Container runtime =="
docker version --format '{{.Server.Version}}'
This is a practical checklist, not a silver bullet. The point is to validate GPU visibility, runtime correctness, storage presence, and network reachability before debugging application code that was never the real problem.
The takeaway: use this pattern when startup SLOs matter more than storage simplicity
This case study did not prove that remote-to-GPU loading replaces every other pattern. It proved something more useful:
- If you run an elastic GPU inference fleet on Azure
- If cold starts are frequent enough to affect cost or user experience
- If your models fit cleanly in available VRAM
- If your storage and network path are strong enough
- If you instrument startup by phase rather than by pod status alone
…then a Blob-first, GPU-oriented loading path can cut cold-start penalties substantially.
My practical decision framework is:
- Choose Blob-first plus local cache for elastic fleets, centralized artifact management, and frequent node churn
- Choose NVMe-heavy preload for stable, long-lived nodes where warm-cache performance dominates
- Choose image-packaged weights only when artifacts are smaller or reproducibility outweighs pull-time penalties
The biggest lesson from this deployment was that startup performance is a systems problem, not a storage trick. The winning architecture improved Blob delivery, reduced staging overhead, respected VRAM limits, and treated node validation as part of the load path.
If you are running this pattern today, I’d be interested in your measured bottleneck and your cold-start delta by architecture choice: image-packaged weights, local NVMe preload, or Blob-first GPU-oriented loading. In your environment, what dominated first-token time—storage, network, host RAM, or VRAM headroom?
#AzureAI #AKS #LLMOps
Code Reference
Additional code samples that complement the tutorial above.
Sample 1 (yaml)
# Kubernetes deployment settings for direct-to-GPU weight loading on Azure.
apiVersion: apps/v1
kind: Deployment
metadata:
  name: llm-inference
spec:
  template:
    spec:
      nodeSelector:
        accelerator: nvidia
      containers:
        - name: server
          image: ghcr.io/example/llm-server:latest
          env:
            - name: MODEL_LOAD_STRATEGY
              value: direct-gpu
            - name: MODEL_SOURCE_URI
              value: https://storage.example/models/llm/
            - name: USE_PINNED_HOST_FALLBACK
              value: "true"
          resources:
            limits:
              nvidia.com/gpu: "1"
Sources & References
- we have GPU servers and we are using ollama models on to it we have nvme disk attached to it. we wanted to know did ollama models will work better on nvme or os disk? we are using autoshutdown and autostart to save cost as well. - Microsoft Q&A
- Comparing GPU types in Azure Container Apps
- Fully Sharded Data Parallel (FSDP) training - Azure Databricks
- Load data on AI Runtime - Azure Databricks
- Networking recommendations for AI workloads on Azure infrastructure (IaaS) - Cloud Adoption Framework
- GPU best practices for Azure Kubernetes Service (AKS) - Azure Kubernetes Service
- Could you provide information on the minimum GPU requirements and the supported virtual machines for the phi-3-medium-128k-instruct model in Azure? - Microsoft Q&A
Try it yourself
Run this tutorial as a Jupyter notebook: Download runbook.ipynb (29 cells, 23 KB).