Copilot Metrics Are Hiding Your Adoption Risk
How to Measure Copilot Cowork Adoption and Impact in Microsoft 365
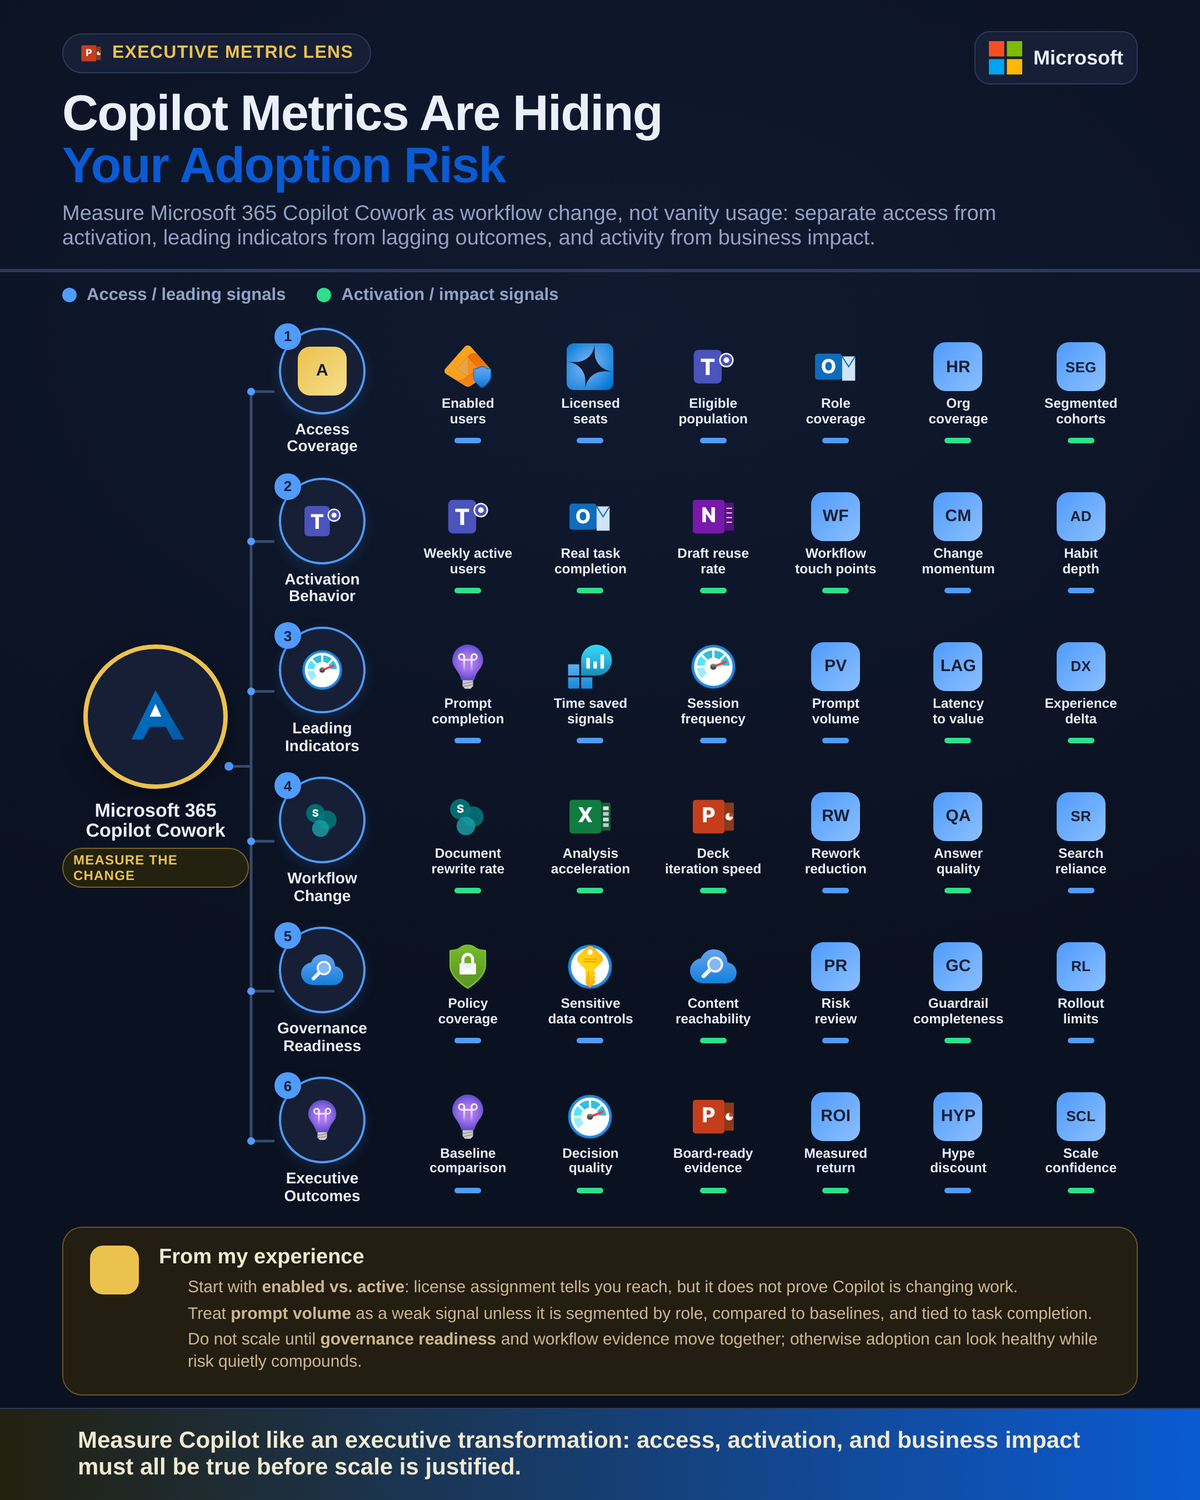
Copilot dashboards got better. That makes bad measurement more dangerous, not less.
Microsoft now gives leaders more Copilot analytics than it did at launch, which is exactly why the measurement conversation needs to get sharper. The real question is not whether Microsoft 365 Copilot is being used, but whether work is changing in ways that justify scale.
The next Copilot debate is not deployment. It is measurement quality.
The easy phase is over. The first wave of Microsoft 365 Copilot conversations was about licensing, technical readiness, and safe deployment. The next phase is harder: deciding what evidence should justify expansion.
My opinion is simple: executive teams should stop treating raw Copilot activity as proof of impact. More dashboards do not automatically create better decisions. They just make it easier to optimize for vanity metrics faster.
Microsoft’s own reporting model points in this direction. In the Microsoft 365 admin center, Copilot usage reporting distinguishes enabled users from usage-oriented measures, which is an important design choice because license assignment is not the same thing as active value realization (Microsoft 365 admin center usage reporting: https://learn.microsoft.com/en-us/microsoft-365/admin/activity-reports/microsoft-365-copilot-usage). Microsoft also points customers to both the Copilot Dashboard in Viva Insights and Microsoft 365 usage reports to assess organizational impact and user sentiment, not just technical availability (setup guidance: https://learn.microsoft.com/en-us/microsoft-365/copilot/microsoft-365-copilot-setup).
That matters because enablement is getting easier. The risk is that enterprises scale before they define what “working” actually means.
A better scorecard separates:
- access from adoption
- leading indicators from lagging outcomes
- workflow change from AI hype
- usage from governance and cost readiness
Last quarter, a 9,000-seat services firm showed me a rollout summary where 82% of assigned users were labeled “adopted” because they had activity in a 30-day window, but no one could answer whether account managers were actually closing meeting follow-ups faster in Outlook or Word.
That is not a measurement problem. That is a leadership problem.
Stop mistaking access metrics for adoption
The most common Copilot reporting mistake is conflating exposure with success.
Access metrics are still useful:
- licenses purchased
- licenses assigned
- enabled users
- app availability
- policy coverage
- technical rollout completion
But none of those are adoption.
Even prompt counts and active-user tallies are only partial signals. A user can trigger Copilot once in Teams and once in Word and still deliver zero durable workflow change. Another user can generate a high prompt count because they are experimenting badly, not because they are working better.
So here is the framing I recommend:
- Access metrics = exposure
- Activation metrics = early engagement
- Workflow metrics = behavior change
- Outcome metrics = business value
- Governance metrics = safe scale
If you collapse those into one number, you lose the plot.
Build an executive scorecard with four measurement layers
If you want a practical operating model, build a scorecard with four layers and review them together every month.
Layer 1: Access and readiness
This is the deployment foundation:
- eligible users
- licenses assigned
- app and channel availability
- security and compliance policy coverage
- knowledge and data access hygiene
- support readiness and training completion
This layer matters because weak readiness distorts every downstream metric. Microsoft’s Copilot documentation for IT pros now spans planning, governance, privacy, architecture, and operations, which is a strong signal that measurement belongs inside a broader operating model, not as a standalone dashboard exercise (https://learn.microsoft.com/en-us/microsoft-365/copilot/).
Layer 2: Activation
This tells you whether users are crossing from access into behavior:
- weekly active Copilot users
- repeat usage over multiple weeks
- feature breadth across Word, Outlook, Teams, and other Microsoft 365 surfaces
- manager participation
- completion of onboarding and enablement steps
Microsoft Learn’s adoption training emphasizes onboarding, enablement strategies, and user adoption planning, which is exactly why activation metrics should be interpreted in the context of change management rather than treated as self-explanatory signals (https://learn.microsoft.com/en-us/training/paths/explore-how-drive-adoption-microsoft-copilot-m365/).
Layer 3: Workflow behavior
This is where the scorecard starts getting serious:
- meeting follow-up completion patterns
- email summarization habits
- document drafting and revision behavior
- recurring scenario usage by role
- time reallocation signals
- handoff quality in routine knowledge work
These are not always available as neat out-of-the-box KPI tiles. You often need to infer them by combining usage data, role segmentation, and process evidence.
Layer 4: Business and governance outcomes
This is where executives usually jump too early, but it still belongs on the scorecard:
- employee sentiment
- support burden
- cycle-time changes for targeted workflows
- quality improvements in repeatable tasks
- compliance posture
- cost per meaningful use case
- spend against usage-based AI consumption where applicable
Microsoft now supports usage-based billing and Copilot Credits cost management for AI experiences, which means behavior metrics increasingly need to connect to spend governance as well (https://learn.microsoft.com/en-us/microsoft-365/copilot/usage-based-billing-manage-copilot-credits).
A simple architecture for operationalizing that scorecard looks like this:
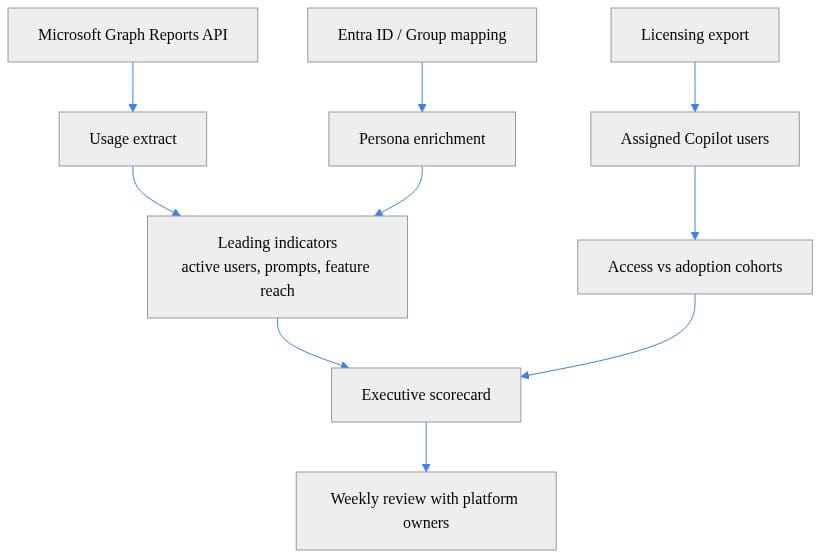
What to notice: the model separates raw usage extraction from persona enrichment and from the executive scorecard. That separation is the difference between reporting and management.
Leading indicators matter more than premature ROI claims
Most organizations want to start with ROI. That is the wrong sequence.
Lagging outcomes like productivity gains, cycle-time reduction, quality improvement, or retention effects are real, but they are slow to prove and easy to over-attribute. If you have not established stable usage patterns and a baseline, your ROI deck is mostly storytelling.
Leading indicators are more reliable early on:
- repeat use over several weeks
- breadth across multiple Copilot surfaces
- manager participation
- scenario diversity by role
- completion of training and onboarding
- reduction in first-use-only users
- growth in habitual users, not just one-time users
This is where a lightweight tutorial workflow helps. Start by pulling usage detail, then classify users into cohorts such as assigned, activated once, and habitual.
# Pull a Microsoft 365 Copilot usage report CSV and load it into pandas
import io
import os
import pandas as pd
import requests

access_token = os.environ["GRAPH_TOKEN"]
url = "https://graph.microsoft.com/v1.0/reports/getMicrosoft365CopilotUsageUserDetail(period='D30')"

headers = {"Authorization": f"Bearer {access_token}"}
response = requests.get(url, headers=headers, timeout=60, allow_redirects=False)
download_url = response.headers.get("Location", response.text.strip())

csv_response = requests.get(download_url, timeout=60)
csv_response.raise_for_status()
usage_df = pd.read_csv(io.StringIO(csv_response.text))

print(usage_df.head(3).to_string(index=False))
What to notice: this example retrieves a Microsoft 365 Copilot usage detail report through Microsoft Graph. It is illustrative, not production-ready, and Graph reporting endpoints require the right permissions and licensing context; report availability and fields can also vary over time. But it shows the right pattern for moving beyond screenshots and into repeatable measurement.
Next, compare assigned access with actual activity so your adoption discussion starts with truth instead of optimism.
# Compare assigned Copilot access with active usage cohorts and calculate adoption rates
import pandas as pd

licenses_df = pd.DataFrame([
    {"userPrincipalName": "alex@contoso.com", "copilotAssigned": True},
    {"userPrincipalName": "maya@contoso.com", "copilotAssigned": True},
    {"userPrincipalName": "li@contoso.com", "copilotAssigned": True},
    {"userPrincipalName": "sam@contoso.com", "copilotAssigned": True},
])

usage_df = pd.DataFrame([
    {"userPrincipalName": "alex@contoso.com", "activeDays": 12},
    {"userPrincipalName": "maya@contoso.com", "activeDays": 4},
    {"userPrincipalName": "li@contoso.com", "activeDays": 9},
])

cohorts = licenses_df.merge(usage_df, on="userPrincipalName", how="left").fillna({"activeDays": 0})
summary = {
    "assigned": int(cohorts["copilotAssigned"].sum()),
    "activated_once": int(cohorts["activeDays"].gt(0).sum()),
    "habitual_users": int(cohorts["activeDays"].ge(8).sum()),
}
summary["activation_rate"] = round(summary["activated_once"] / summary["assigned"], 2)
summary["habit_rate"] = round(summary["habitual_users"] / summary["assigned"], 2)

print(summary)
What to notice: activation rate and habit rate are not the same thing. That distinction is one of the most useful corrections an executive team can make.
Microsoft’s API direction supports this approach. Microsoft 365 Copilot APIs include usage reports API capabilities for querying user counts and usage data, which makes it possible to automate scorecards rather than rely on manual dashboard review (https://learn.microsoft.com/en-us/microsoft-365/copilot/extensibility/copilot-apis-overview).
Segment by role or your averages will lie
A tenant-wide average is the fastest way to misunderstand Copilot.
Executives, sales teams, operations staff, HR, legal, service desks, and general knowledge workers do not use Copilot in the same way, at the same frequency, or for the same value. A single blended adoption rate hides the only question that matters: for whom is work changing in a measurable way?
This is where the Copilot Dashboard in Viva Insights becomes more useful. The dashboard is available to Microsoft 365 and Office 365 business and enterprise customers, with expanded Copilot views for tenants that have at least one Copilot license (https://learn.microsoft.com/en-us/viva/insights/org-team-insights/copilot-dashboard). It can show organizational patterns, but interpretation gets much stronger when you layer in persona, team, geography, and manager-led rollout waves.
Do not segment only by org chart. Segment by workflow-heavy personas:
- account executives who live in Outlook, Teams, and Word
- project managers who depend on meeting recap and follow-up
- operations analysts drafting recurring summaries
- HR partners producing policy and communication drafts
- legal reviewers summarizing long documents
Then reshape the data into persona-based indicators.
# Reshape Copilot usage into an executive scorecard by persona and indicator type
import pandas as pd

usage_df = pd.DataFrame([
    {"userPrincipalName": "alex@contoso.com", "persona": "Sales", "period": "Last30Days", "activeDays": 12, "promptActions": 88, "assistedMeetings": 6},
    {"userPrincipalName": "maya@contoso.com", "persona": "HR", "period": "Last30Days", "activeDays": 4, "promptActions": 15, "assistedMeetings": 1},
    {"userPrincipalName": "li@contoso.com", "persona": "Sales", "period": "Last30Days", "activeDays": 9, "promptActions": 52, "assistedMeetings": 4},
])

scorecard = (
    usage_df.assign(
        leading_active_users=usage_df["activeDays"].gt(0).astype(int),
        leading_power_users=usage_df["activeDays"].ge(8).astype(int),
        lagging_productivity_proxy=usage_df["assistedMeetings"] + usage_df["promptActions"] / 20.0,
    )
    .groupby(["persona", "period"], as_index=False)
    .agg(
        assigned_users=("userPrincipalName", "nunique"),
        active_users=("leading_active_users", "sum"),
        power_users=("leading_power_users", "sum"),
        avg_prompt_actions=("promptActions", "mean"),
        productivity_proxy=("lagging_productivity_proxy", "mean"),
    )
)

print(scorecard.to_string(index=False))
What to notice: this scorecard does not pretend prompt volume is business impact. It uses prompt actions and assisted meetings as inputs to persona-level indicators, which is a more honest way to brief leadership.
The right executive question is not “Is adoption up?” It is “Which roles are showing repeatable workflow change, in which scenarios, under what conditions?”
Baseline first, then talk about impact
If you did not capture a before state, your after story is weak.
That is especially true with Copilot because workload intensity changes for reasons that have nothing to do with AI:
- quarter-end sales cycles
- seasonal support volume
- reorganizations
- policy changes
- manager turnover
- training quality
- parallel process redesign
So baseline first:
- time spent on targeted tasks
- throughput for known workflows
- quality or error rates where measurable
- employee friction or sentiment
- support tickets and escalation patterns
- manager reinforcement and enablement completion
Then use phased rollouts, comparison groups, or before-and-after snapshots to reduce false attribution.
Microsoft itself points customers toward both usage and sentiment measurement, not just raw activity, through the combination of Viva Insights and Microsoft 365 reporting (https://learn.microsoft.com/en-us/microsoft-365/copilot/microsoft-365-copilot-setup). That is the right signal.
A practical operating rhythm is:
- establish baseline for a few priority workflows
- launch in waves by persona
- monitor leading indicators weekly
- review workflow evidence monthly
- assess lagging outcomes only after usage stabilizes
Governance and cost are part of impact
A rollout with rising usage and weak governance is not a success story. It is deferred risk.
This is where many executive teams still split the room incorrectly:
- the business reviews adoption
- IT reviews governance
- finance reviews spend
- no one sees the combined picture
That model fails at scale.
Microsoft’s Copilot guidance explicitly includes privacy, architecture, governance, and operational planning, which means the platform should be measured as an operating system for work, not as a novelty feature set (https://learn.microsoft.com/en-us/microsoft-365/copilot/). If data access hygiene is poor, if exception handling is ad hoc, or if policy coverage is inconsistent, then your adoption metric is overstating readiness.
The same is true for cost. As usage-based billing and Copilot Credits become more relevant in some AI experiences, leaders need a direct line from behavior to spend governance (https://learn.microsoft.com/en-us/microsoft-365/copilot/usage-based-billing-manage-copilot-credits). Not every prompt is equally valuable. Not every active user is worth scaling immediately.
This is why I recommend one scorecard, not three:
- access and readiness
- activation
- workflow change
- business outcomes
- governance and cost posture
If you want to automate the reporting cadence, a simple scheduled extract-and-enrich flow is enough to start.
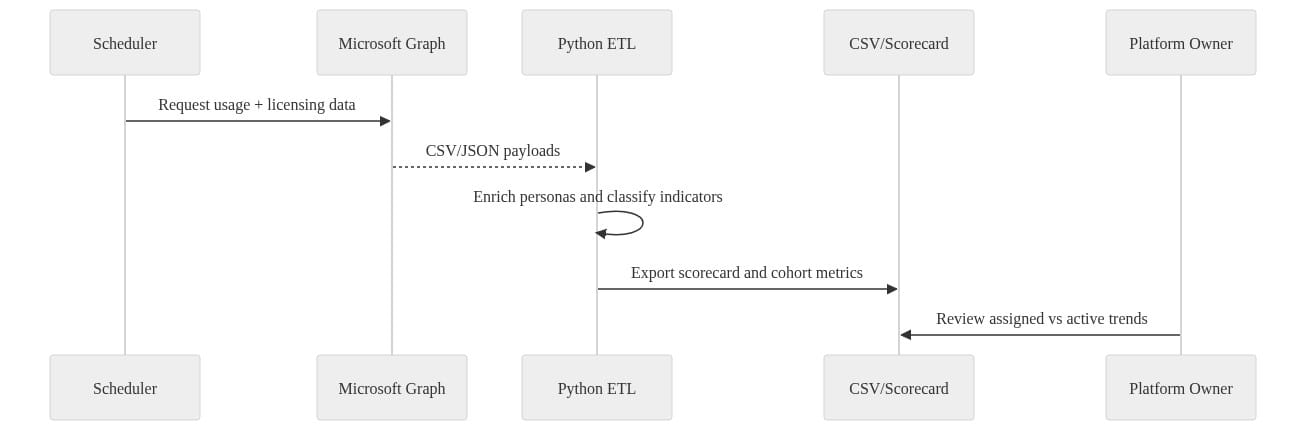
What to notice: the review loop ends with a platform owner looking at assigned-versus-active trends. That governance checkpoint is not administrative overhead. It is the control point that keeps rollout decisions grounded.
What Microsoft’s analytics stack does well, and where leaders still need judgment
Microsoft’s analytics stack is materially better than it was at launch.
Use the tools for what they are good at:
- Microsoft 365 admin center usage reporting for usage detail and enabled-user visibility
- Viva Insights Copilot Dashboard for organizational patterns and sentiment-adjacent context
- Microsoft Graph usage reports APIs for repeatable extraction and custom scorecards
But do not ask Microsoft’s dashboards to define business value for you. They cannot.
They can show:
- activity
- trends
- breadth
- cohorts
- organizational patterns
They cannot decide:
- which workflows matter most
- what baseline to compare against
- which role segments justify expansion
- whether governance posture is strong enough for scale
- what level of spend is acceptable for each use case
That is executive work.
My bottom line: the organizations that win with Microsoft 365 Copilot will not be the ones with the prettiest dashboard. They will be the ones disciplined enough to measure behavior change, segment by role, establish baselines, and keep governance in the same conversation as adoption.
The board-level question should be sharper: Where is Copilot changing work in measurable, governable, repeatable ways worth scaling?
If your current answer is still “licensed users are up,” you are not measuring impact. You are counting exposure.
Rate your team’s current Copilot measurement discipline from 1 to 5: are you still reporting access, or are you actually proving workflow change?
#Microsoft365Copilot #VivaInsights #EnterpriseAI
Sources & References
- Microsoft 365 Copilot hub
- Connect to the Microsoft Copilot Dashboard for Microsoft 365 customers
- MS-4007: Discover how to drive enablement of Microsoft 365 Copilot in your organization - Training
- Microsoft 365 Copilot Usage Report - Microsoft 365 admin
- Microsoft 365 Copilot APIs Overview
- Managing AI experiences enabled by usage-based billing
- Set Up Microsoft 365 Copilot and Assign Licenses
Try it yourself
Run this tutorial as a Jupyter notebook: Download runbook.ipynb (29 cells, 25 KB).