Ceph OSD latency watchdog for Proxmox home labs
Self-Healing Ceph: Building an OSD Latency Watchdog for a Proxmox Home Lab


A single slow OSD can make a healthy-looking Proxmox Ceph cluster feel haunted at 3 AM.
One of my home lab clusters did exactly that. VMs paused just long enough to make me suspect bridge networking, then storage graphs looked mostly fine, then Proxmox felt sticky in the UI, then everything recovered before I could pin it down. Classic bad night. The cluster wasn’t dead. It was worse: intermittently weird.
That pattern matters because small Ceph clusters fail ugly. In a three-node Proxmox setup, one marginal OSD can create tail-latency spikes that show up first as guest IO wait, random VM freezes, slow migrations, or “it feels like the node is overloaded” complaints. If you chase only the guest symptom, you burn hours in the wrong layer.
In one customer lab back in 2023, a 6-node validation cluster spent two weeks getting blamed on corosync and jumbo frames before ceph osd perf exposed a single SATA SSD with latency spikes north of 400 ms during light write bursts.
This tutorial is the path I now use:
- find the real signal
- avoid the wrong fix
- build a narrow watchdog that restarts one OSD only when conditions are actually safe enough
- treat that watchdog as a seatbelt while you work on the real fix: better storage
I’m going hands-on here. Bash, systemd timer, guardrails, cooldowns, and the exact places where automation should refuse to be clever.
Step 1: Start with the symptom, but don’t trust it
What the cluster looked like from the outside
At 3 AM, the first signs rarely scream “OSD latency.” They look like this:
- one or two VMs freeze for a few seconds
- SSH to a guest gets sticky
- Proxmox web UI loads, but actions lag
- node CPU is fine
- RAM pressure is fine
- network graphs look boring
- Ceph health may show warnings, but not always something dramatic
That’s why people misdiagnose it as:
- a noisy VM
- a bad bridge or bond
- corosync instability
- a host CPU scheduling issue
- some random Proxmox regression
Why small clusters are especially deceptive
In a small home lab, every OSD carries a larger share of the pain. One outlier disk can distort client experience without making the whole cluster obviously red. Cluster-wide averages are useless here. You care about the worst actor, not the mean.
If one OSD has pathological commit or apply latency, the guest sees slow writes. The VM doesn’t know which OSD is guilty. It just knows the storage path got ugly.
So before you touch networking or start rebooting nodes, go straight to Ceph’s live OSD performance data.
Step 2: Check root-cause metrics, not guest drama
The dead ends I check quickly
I still do the fast sanity pass:
- host CPU steal or saturation
- memory exhaustion or swapping
- bridge errors and dropped packets
- corosync stability
- guest-level IO wait
- node thermals if the lab is tucked into a closet like half of ours are
But that pass is there to rule out obvious failures, not to prove storage is innocent.
The turning point: ceph osd perf
The useful signal is live OSD latency, specifically from ceph osd perf.
In practical operator terms:
commit_latency_msis how long it takes the OSD to commit the write transactionapply_latency_msis how long it takes to apply it
When those numbers spike on one OSD while the rest stay normal, you’ve found the likely blast radius. In a healthy all-flash home lab, you expect these values to stay low and relatively tight. If one OSD starts wandering into tens or hundreds of milliseconds while peers remain calm, that outlier matters more than every average dashboard in the stack.
To get a quick read on the worst current OSD, I use a tiny helper first.
# Dry-run helper to inspect the worst OSD from ceph osd perf JSON
#!/usr/bin/env bash
set -euo pipefail
ceph osd perf -f json | jq -r '
  sort_by(-(.apply_latency_ms + .commit_latency_ms)) |
  .[0] as $o |
  "worst=osd.\($o.id) apply=\($o.apply_latency_ms)ms commit=\($o.commit_latency_ms)ms"
'
What you should observe: this gives you the current worst OSD by combined apply and commit latency. Run it several times over a few minutes. If the same OSD keeps showing up, you’ve got a pattern, not a blip.
Why one noisy sample is not enough
Do not restart an OSD because of one bad sample. Ceph is a distributed system. Short bursts happen. You want sustained bad latency, not a single noisy read.
For a home lab, I usually start with a threshold around 80 ms for “this is suspicious enough to watch,” then require multiple consecutive bad samples before any action. Tune that to your media and workload, but the principle is the same: debounce first, act later.
Step 3: Decide when a restart helps and when it absolutely does not
A restart is not a cure. It is a narrow recovery move for a narrow failure mode.
Safe-ish scenarios for an automatic restart
I’ll allow an automated restart only when all of these are true:
- one isolated OSD is the clear outlier
- the cluster is otherwise stable
- no active recovery or backfill storm is underway
- no nearfull or full condition exists
- the host itself is not in broad IO collapse
- there’s no evidence of obvious media failure
That last one matters. If SMART is screaming or the kernel is logging device resets, timeouts, or media errors, restarting the daemon is theater. Replace the drive.
Cases where I will not auto-restart
These are hard no-go conditions:
- multiple slow OSDs at once
- active recovery or backfill pressure
- degraded PGs getting worse
- host-wide storage latency collapse
- SMART/media/controller errors
- repeated incidents on the same device
If the script cannot prove it is safe enough, it should fail closed: log, alert, and do nothing.
Step 4: Design the watchdog with safety rails
Here’s the control loop I want:
- run on a fixed cadence with a systemd timer
- query
ceph osd perf -f json - find OSDs above threshold
- require consecutive bad samples per OSD
- verify cluster guardrails
- enforce per-OSD cooldown
- enforce an hourly restart budget
- restart only the mapped
ceph-osd@ID.service - persist state on disk
- log every decision path
That’s the whole game. Narrow scope. Low blast radius. Auditability.
The flow looks like this.
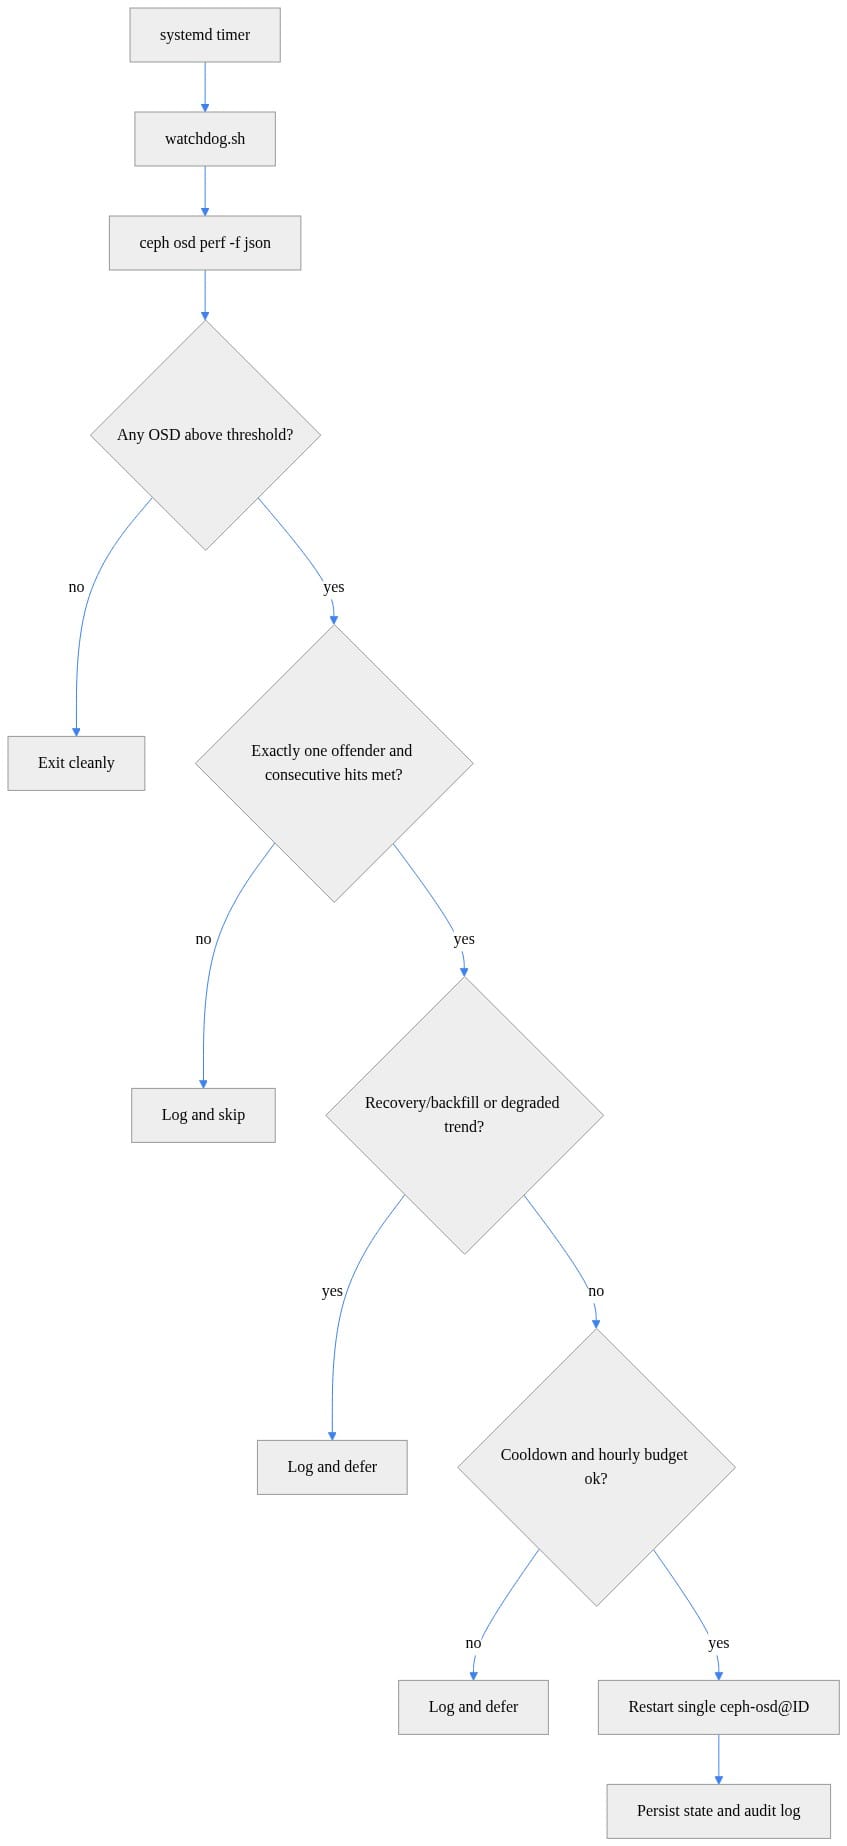
What you should observe: the watchdog only reaches the restart step after threshold checks, debounce, guardrails, and rate limits pass. If your design diagram doesn’t show multiple exits before “restart,” it’s too aggressive.
Why systemd timer beats a while-true loop
I use a oneshot service plus timer instead of a forever shell loop or a random cron job because:
- systemd gives you a clean execution model
- logs land in the journal where they belong
- restart history is easier to audit
- boot-time recovery is cleaner
- the timer is obvious to the next human
This is lab automation, but I still want it to behave like production.
Step 5: Build the Bash watchdog
Prerequisites
On the Proxmox/Ceph node where you run this, you need:
cephCLI access with permission to query cluster statejqsystemd- root privileges to restart OSD services
- a writable state directory such as
/var/lib/osd-watchdog
The script below is still compact enough for a post, but it now matches the design more closely:
- tracks consecutive bad samples per OSD
- skips if more than one OSD is above threshold
- skips during recovery/backfill
- enforces cooldown and hourly restart budget
- restarts one OSD
- persists state and hit counters
# Primary OSD latency watchdog with consecutive-hit tracking and concrete guardrails
#!/usr/bin/env bash
set -euo pipefail

STATE=/var/lib/osd-watchdog/state.json
LOGTAG=osd-watchdog

THRESH_MS="${THRESH_MS:-80}"
COOLDOWN="${COOLDOWN:-1800}"
BUDGET="${BUDGET:-2}"
REQUIRED_HITS="${REQUIRED_HITS:-3}"
MIN_UP_OSDS="${MIN_UP_OSDS:-2}"

perf="$(ceph osd perf -f json)"
status="$(ceph osd stat -f json)"
health="$(ceph health detail -f json 2>/dev/null || ceph health -f json)"

mkdir -p "$(dirname "$STATE")"
[[ -f "$STATE" ]] || echo '{"last_restart":0,"events":[],"hits":{}}' > "$STATE"

bad_ids="$(jq -r --argjson t "$THRESH_MS" '
  map(select((.apply_latency_ms // 0) > $t or (.commit_latency_ms // 0) > $t))
  | sort_by(-(.apply_latency_ms + .commit_latency_ms))
  | .[].id
' <<<"$perf")"

bad_count="$(wc -w <<<"$bad_ids" | tr -d ' ')"
if [[ "$bad_count" -eq 0 ]]; then
  tmp="$(mktemp)"
  jq '.hits = {}' "$STATE" > "$tmp" && mv "$tmp" "$STATE"
  logger -t "$LOGTAG" "healthy: no OSD above ${THRESH_MS}ms"
  exit 0
fi

if [[ "$bad_count" -gt 1 ]]; then
  logger -t "$LOGTAG" "skip: multiple OSDs above threshold (${bad_ids//What you should observe: this version does not pretend to prove a restart is universally safe. It implements a few concrete “refuse to be clever” checks, then acts only when one OSD stays bad across multiple runs.What each variable doesA few knobs matter immediately:THRESH_MS: latency threshold in milliseconds. Start conservative.
REQUIRED_HITS: consecutive bad samples required before action.
COOLDOWN: minimum seconds between restarts. I like 1800 seconds as a floor in a small cluster.
BUDGET: max restarts per hour. Two is a sane starting point.
MIN_UP_OSDS: basic guardrail to avoid acting when the cluster is already too reduced.

Guardrails I still treat as recommended extensionsEven with the improved script, there are checks I’d add in a fuller lab implementation:host-level IO collapse detection from iostat, sar, or device queue metrics
SMART correlation before restart
per-device incident counters that escalate to alert-only mode
explicit degraded-PG trend tracking across runs instead of a single health snapshot
dry-run mode and notification hooks

The point is not to build an “AI for storage.” The point is to make the automation narrow and boring.Example pseudocode for extra refusal logicIf you want to extend the watchdog without turning the post into a full package, these are the next checks I’d add:if smartctl shows media errors increasing on the backing device:
    skip and alert

if host-wide disk await is elevated across multiple devices:
    skip because restarting one OSD is unlikely to help

if the same OSD has triggered N times in 24h:
    stop auto-restarting that OSD and mark it for replacement
Step 6: Understand the decision path before you automate itThe sequence below is the operational story your timer should tell every time it runs.What you should observe: there are two valid outcomes every run—either one controlled restart, or a logged skip reason. “Do nothing because conditions are ambiguous” is a successful outcome, not a failure.Step 7: Install it as a systemd service and timerThe service unitUse a oneshot service. That keeps each run isolated and journal-friendly.# systemd oneshot service for the watchdog with journal-friendly output
[Unit]
Description=Ceph OSD latency watchdog
After=network-online.target
Wants=network-online.target

[Service]
Type=oneshot
ExecStart=/usr/local/sbin/osd-latency-watchdog.sh
User=root
Group=root
Nice=10
IOSchedulingClass=best-effort
What you should observe: the service is simple on purpose. No daemon wrapper, no forking behavior, no shell gymnastics. One invocation, one decision cycle.The timer unitFor home lab Ceph, I prefer a fixed cadence. Every 5 minutes is a reasonable default if your threshold logic already requires sustained bad behavior. If you want faster detection, shorten the cadence but make the debounce stricter.# systemd timer to run the watchdog every 5 minutes with persistence
[Unit]
Description=Run Ceph OSD latency watchdog on a fixed cadence

[Timer]
OnBootSec=2min
OnUnitActiveSec=5min
Persistent=true
Unit=osd-latency-watchdog.service

[Install]
WantedBy=timers.target
What you should observe: Persistent=true matters. If the node was down, the timer catches up cleanly rather than silently skipping the schedule.Install and enable the unitsHere’s the small install helper I use when I’m pushing this onto a node.# Install and enable the watchdog units on a Proxmox/Ceph node
#!/usr/bin/env bash
set -euo pipefail
install -Dm755 ./osd-latency-watchdog.sh /usr/local/sbin/osd-latency-watchdog.sh
install -Dm644 ./osd-latency-watchdog.service /etc/systemd/system/osd-latency-watchdog.service
install -Dm644 ./osd-latency-watchdog.timer /etc/systemd/system/osd-latency-watchdog.timer
systemctl daemon-reload
systemctl enable --now osd-latency-watchdog.timer
systemctl list-timers --all | grep osd-latency-watchdog
journalctl -u osd-latency-watchdog.service -n 20 --no-pager || true
What you should observe: after daemon-reload, the timer should show up in systemctl list-timers, and the journal should tell you whether the service is running cleanly or failing on prerequisites like missing jq or Ceph CLI access.Step 8: Test safely before you trust itRun dry firstBefore you let anything restart an OSD automatically, do two things:run the helper that identifies the worst OSD
run the watchdog manually with logging enabled, but with the restart line disabled or replaced by an echo in your local copy

You want to prove:it identifies the right OSD
it skips when the cluster is healthy
it waits for consecutive hits
it skips when multiple OSDs are bad
it skips during recovery or backfill
it respects cooldown
it respects the hourly budget

Lower thresholds during a maintenance windowThe safest test is controlled sensitivity:temporarily lower THRESH_MS
create a known write load
confirm the script identifies the offender
confirm it still refuses to act when guardrails fail

Validate the restart budgetThis one is non-negotiable. Without a budget, a bad disk plus bad automation becomes a flapping machine.I’ve seen exactly this pattern in enterprise storage stacks too: the first restart “helps,” so somebody automates it, then the same failing component gets kicked over and over until the cluster spends more time recovering from remediation than from the original fault.Step 9: Tune it for a small Proxmox Ceph clusterThresholds depend on media qualityThis is where people get sloppy.A threshold that is tolerable on old consumer SATA SSDs may be unacceptable on decent enterprise NVMe. Don’t cargo-cult the number. Baseline your own cluster:idle latency
normal VM burst behavior
backup window behavior
scrub/recovery behavior

Then set thresholds above normal variance but below “users notice pain.”Why three-node clusters need conservative automationA big Ceph cluster can absorb more mistakes. A tiny one cannot.In a three-node Proxmox home lab:every restart has visible impact
every OSD carries meaningful weight
recovery pressure arrives quickly
there’s less room for “self-healing” experiments

That’s why I keep the script node-local and dumb. I do not build a distributed control plane for a home lab watchdog. The more moving parts you add, the more likely the automation becomes its own outage source.Pair it with basic health checksAt minimum, combine this with:SMART monitoring
node temperature checks
Ceph health alerting
journal review for storage/controller errors

If the watchdog fires often and SMART starts looking dirty, stop automating and replace hardware.Step 10: Remember that the durable fix is better storageHere’s the part that matters most.The watchdog reduced incidents in my lab. It did not solve the root cause.The durable fix was replacing weak SSDs with enterprise SSDs. Once I moved off marginal consumer drives, the tail-latency spikes dropped hard. The cluster stopped feeling haunted. That’s exactly what I’d expect. Ceph punishes inconsistent latency more than people realize, especially in small clusters where one bad device has nowhere to hide.Consumer SSDs can look fine on average throughput and still behave terribly under sustained mixed write pressure, garbage collection, firmware quirks, or power-loss-protection gaps. The problem isn’t always raw speed. It’s latency consistency.So treat this watchdog like a seatbelt:useful during the incident
good at reducing damage
absolutely not the reason to keep driving on bad tires

My rule is simple: if automated restarts become frequent, the script has done its job by proving the drive or storage path is suspect. Replace the hardware.Step 11: Use this copy-paste checklistDeployment checklistinstall jq
verify ceph CLI works on the target node
baseline ceph osd perf under normal load
set THRESH_MS, REQUIRED_HITS, COOLDOWN, and BUDGET
deploy the script and systemd units
run in dry mode first
inspect journal output
validate skip behavior during guardrail failures
enable live mode only after you trust the decision path
review logs weekly
retire bad drives aggressively

The blunt versionIf you skip the guardrails, you’ll build a reboot hammer.If you skip cooldowns and restart budgets, you’ll create flapping.If you ignore repeated incidents, you’ll hide a dying drive until it fails at the worst time.If you buy better SSDs, you’ll need this a lot less.That’s the real lesson.If you run Ceph in a lab or production, what thresholds, debounce windows, or guardrails do you use for storage watchdogs? I’m especially interested in how people handle recovery/backfill suppression, SMART correlation, and repeat-offender cutoffs.#Proxmox #Ceph #HomeLabCode ReferenceAdditional code samples that complement the tutorial above.Sample 1 (python)Intentionally simplified for readability; this sample omits several production guardrails shown in the Bash version.# Python version of the decision logic for easier testing and extension
#!/usr/bin/env python3
import json, subprocess, time, pathlib
THRESH_MS, COOLDOWN, BUDGET = 80, 1800, 2
state_path = pathlib.Path("/var/lib/osd-watchdog/state.json")
perf = json.loads(subprocess.check_output(["ceph", "osd", "perf", "-f", "json"]))
bad = sorted([o for o in perf if o.get("apply_latency_ms", 0) > THRESH_MS or o.get("commit_latency_ms", 0) > THRESH_MS],
             key=lambda o: o.get("apply_latency_ms", 0) + o.get("commit_latency_ms", 0), reverse=True)
if not bad: raise SystemExit("healthy")
state = json.loads(state_path.read_text()) if state_path.exists() else {"last_restart": 0, "events": []}
now = int(time.time())
recent = [e for e in state["events"] if e["ts"] >= now - 3600]
if now - state["last_restart"] < COOLDOWN or len(recent) >= BUDGET: raise SystemExit("rate-limited")
osd_id = bad[0]["id"]
subprocess.check_call(["systemctl", "restart", f"ceph-osd@{osd_id}.service"])
state["last_restart"] = now; state["events"] = recent + [{"ts": now, "osd": osd_id}]
state_path.parent.mkdir(parents=True, exist_ok=True); state_path.write_text(json.dumps(state))
print(f"restarted osd.{osd_id}")

Sources & ReferencesCeph documentation: OSD Config Reference
Ceph documentation: Monitoring a Cluster
Ceph documentation: Placement Groups and states
Ceph documentation: Ceph health checks
Ceph documentation: ceph-volume and OSD management
Proxmox VE documentation: Deploy Hyper-Converged Ceph Cluster
systemd.timer(5)
systemd.service(5)
smartctl(8) manual page
smartd(8) manual page\n'/,})"
  exit 0
fi

target="$(head -n1 <<<"$bad_ids")"

up_osds="$(jq -r '.num_up_osds // 0' <<<"$status")"
[[ "$up_osds" -gt "$MIN_UP_OSDS" ]] || {
  logger -t "$LOGTAG" "skip: only $up_osds OSDs up"
  exit 0
}

recovery_active="$(jq -r '
  [
    (.checks // {})[]?.summary?.message?,
    (.checks // {})[]?.detail[]?.message?
  ]
  | map(select(type=="string"))
  | any(test("recovery|backfill|degraded|peering|undersized"; "i"))
' <<<"$health")"

[[ "$recovery_active" == "false" ]] || {
  logger -t "$LOGTAG" "skip: cluster health indicates recovery/backfill/degraded activity"
  exit 0
}

tmp="$(mktemp)"
jq --arg id "$target" '
  .hits = (.hits // {}) |
  .hits[$id] = ((.hits[$id] // 0) + 1)
' "$STATE" > "$tmp" && mv "$tmp" "$STATE"

hits="$(jq -r --arg id "$target" '.hits[$id] // 0' "$STATE")"
if (( hits < REQUIRED_HITS )); then
  logger -t "$LOGTAG" "defer: osd.$target above threshold, consecutive hits ${hits}/${REQUIRED_HITS}"
  exit 0
fi

now="$(date +%s)"
last="$(jq -r '.last_restart // 0' "$STATE")"
(( now - last >= COOLDOWN )) || {
  logger -t "$LOGTAG" "skip: cooldown active for osd.$target"
  exit 0
}

hour_ago=$((now - 3600))
used="$(jq -r --argjson h "$hour_ago" '[.events[] | select(.ts >= $h)] | length' "$STATE")"
(( used < BUDGET )) || {
  logger -t "$LOGTAG" "skip: hourly restart budget exhausted"
  exit 0
}

systemctl restart "ceph-osd@${target}.service"

tmp="$(mktemp)"
jq --argjson now "$now" --arg id "$target" '
  .last_restart = $now
  | .events += [{"ts":$now,"osd":($id|tonumber)}]
  | .hits[$id] = 0
' "$STATE" > "$tmp" && mv "$tmp" "$STATE"

logger -t "$LOGTAG" "restarted ceph-osd@${target}.service after ${REQUIRED_HITS} consecutive bad samples over ${THRESH_MS}ms"
What you should observe: this version does not pretend to prove a restart is universally safe. It implements a few concrete “refuse to be clever” checks, then acts only when one OSD stays bad across multiple runs.
What each variable does
A few knobs matter immediately:
THRESH_MS: latency threshold in milliseconds. Start conservative.REQUIRED_HITS: consecutive bad samples required before action.COOLDOWN: minimum seconds between restarts. I like 1800 seconds as a floor in a small cluster.BUDGET: max restarts per hour. Two is a sane starting point.MIN_UP_OSDS: basic guardrail to avoid acting when the cluster is already too reduced.
Guardrails I still treat as recommended extensions
Even with the improved script, there are checks I’d add in a fuller lab implementation:
- host-level IO collapse detection from
iostat,sar, or device queue metrics - SMART correlation before restart
- per-device incident counters that escalate to alert-only mode
- explicit degraded-PG trend tracking across runs instead of a single health snapshot
- dry-run mode and notification hooks
The point is not to build an “AI for storage.” The point is to make the automation narrow and boring.
Example pseudocode for extra refusal logic
If you want to extend the watchdog without turning the post into a full package, these are the next checks I’d add:
CB3
Step 6: Understand the decision path before you automate it
The sequence below is the operational story your timer should tell every time it runs.
CB4
What you should observe: there are two valid outcomes every run—either one controlled restart, or a logged skip reason. “Do nothing because conditions are ambiguous” is a successful outcome, not a failure.
Step 7: Install it as a systemd service and timer
The service unit
Use a oneshot service. That keeps each run isolated and journal-friendly.
CB5
What you should observe: the service is simple on purpose. No daemon wrapper, no forking behavior, no shell gymnastics. One invocation, one decision cycle.
The timer unit
For home lab Ceph, I prefer a fixed cadence. Every 5 minutes is a reasonable default if your threshold logic already requires sustained bad behavior. If you want faster detection, shorten the cadence but make the debounce stricter.
CB6
What you should observe: Persistent=true matters. If the node was down, the timer catches up cleanly rather than silently skipping the schedule.
Install and enable the units
Here’s the small install helper I use when I’m pushing this onto a node.
CB7
What you should observe: after daemon-reload, the timer should show up in systemctl list-timers, and the journal should tell you whether the service is running cleanly or failing on prerequisites like missing jq or Ceph CLI access.
Step 8: Test safely before you trust it
Run dry first
Before you let anything restart an OSD automatically, do two things:
- run the helper that identifies the worst OSD
- run the watchdog manually with logging enabled, but with the restart line disabled or replaced by an echo in your local copy
You want to prove:
- it identifies the right OSD
- it skips when the cluster is healthy
- it waits for consecutive hits
- it skips when multiple OSDs are bad
- it skips during recovery or backfill
- it respects cooldown
- it respects the hourly budget
Lower thresholds during a maintenance window
The safest test is controlled sensitivity:
- temporarily lower
THRESH_MS - create a known write load
- confirm the script identifies the offender
- confirm it still refuses to act when guardrails fail
Validate the restart budget
This one is non-negotiable. Without a budget, a bad disk plus bad automation becomes a flapping machine.
I’ve seen exactly this pattern in enterprise storage stacks too: the first restart “helps,” so somebody automates it, then the same failing component gets kicked over and over until the cluster spends more time recovering from remediation than from the original fault.
Step 9: Tune it for a small Proxmox Ceph cluster
Thresholds depend on media quality
This is where people get sloppy.
A threshold that is tolerable on old consumer SATA SSDs may be unacceptable on decent enterprise NVMe. Don’t cargo-cult the number. Baseline your own cluster:
- idle latency
- normal VM burst behavior
- backup window behavior
- scrub/recovery behavior
Then set thresholds above normal variance but below “users notice pain.”
Why three-node clusters need conservative automation
A big Ceph cluster can absorb more mistakes. A tiny one cannot.
In a three-node Proxmox home lab:
- every restart has visible impact
- every OSD carries meaningful weight
- recovery pressure arrives quickly
- there’s less room for “self-healing” experiments
That’s why I keep the script node-local and dumb. I do not build a distributed control plane for a home lab watchdog. The more moving parts you add, the more likely the automation becomes its own outage source.
Pair it with basic health checks
At minimum, combine this with:
- SMART monitoring
- node temperature checks
- Ceph health alerting
- journal review for storage/controller errors
If the watchdog fires often and SMART starts looking dirty, stop automating and replace hardware.
Step 10: Remember that the durable fix is better storage
Here’s the part that matters most.
The watchdog reduced incidents in my lab. It did not solve the root cause.
The durable fix was replacing weak SSDs with enterprise SSDs. Once I moved off marginal consumer drives, the tail-latency spikes dropped hard. The cluster stopped feeling haunted. That’s exactly what I’d expect. Ceph punishes inconsistent latency more than people realize, especially in small clusters where one bad device has nowhere to hide.
Consumer SSDs can look fine on average throughput and still behave terribly under sustained mixed write pressure, garbage collection, firmware quirks, or power-loss-protection gaps. The problem isn’t always raw speed. It’s latency consistency.
So treat this watchdog like a seatbelt:
- useful during the incident
- good at reducing damage
- absolutely not the reason to keep driving on bad tires
My rule is simple: if automated restarts become frequent, the script has done its job by proving the drive or storage path is suspect. Replace the hardware.
Step 11: Use this copy-paste checklist
Deployment checklist
- install
jq - verify
cephCLI works on the target node - baseline
ceph osd perfunder normal load - set
THRESH_MS,REQUIRED_HITS,COOLDOWN, andBUDGET - deploy the script and systemd units
- run in dry mode first
- inspect journal output
- validate skip behavior during guardrail failures
- enable live mode only after you trust the decision path
- review logs weekly
- retire bad drives aggressively
The blunt version
If you skip the guardrails, you’ll build a reboot hammer.
If you skip cooldowns and restart budgets, you’ll create flapping.
If you ignore repeated incidents, you’ll hide a dying drive until it fails at the worst time.
If you buy better SSDs, you’ll need this a lot less.
That’s the real lesson.
If you run Ceph in a lab or production, what thresholds, debounce windows, or guardrails do you use for storage watchdogs? I’m especially interested in how people handle recovery/backfill suppression, SMART correlation, and repeat-offender cutoffs.
#Proxmox #Ceph #HomeLab
Code Reference
Additional code samples that complement the tutorial above.
Sample 1 (python)
Intentionally simplified for readability; this sample omits several production guardrails shown in the Bash version.
CB8
Sources & References
- Ceph documentation: OSD Config Reference
- Ceph documentation: Monitoring a Cluster
- Ceph documentation: Placement Groups and states
- Ceph documentation: Ceph health checks
- Ceph documentation: ceph-volume and OSD management
- Proxmox VE documentation: Deploy Hyper-Converged Ceph Cluster
- systemd.timer(5)
- systemd.service(5)
- smartctl(8) manual page
- smartd(8) manual page
Try it yourself
Run this tutorial as a Jupyter notebook: Download runbook.ipynb (22 cells, 25 KB).