Azure Monitor in Fabric for AI Observability Strategy
How Azure Monitor in Fabric can become your AI-era observability layer
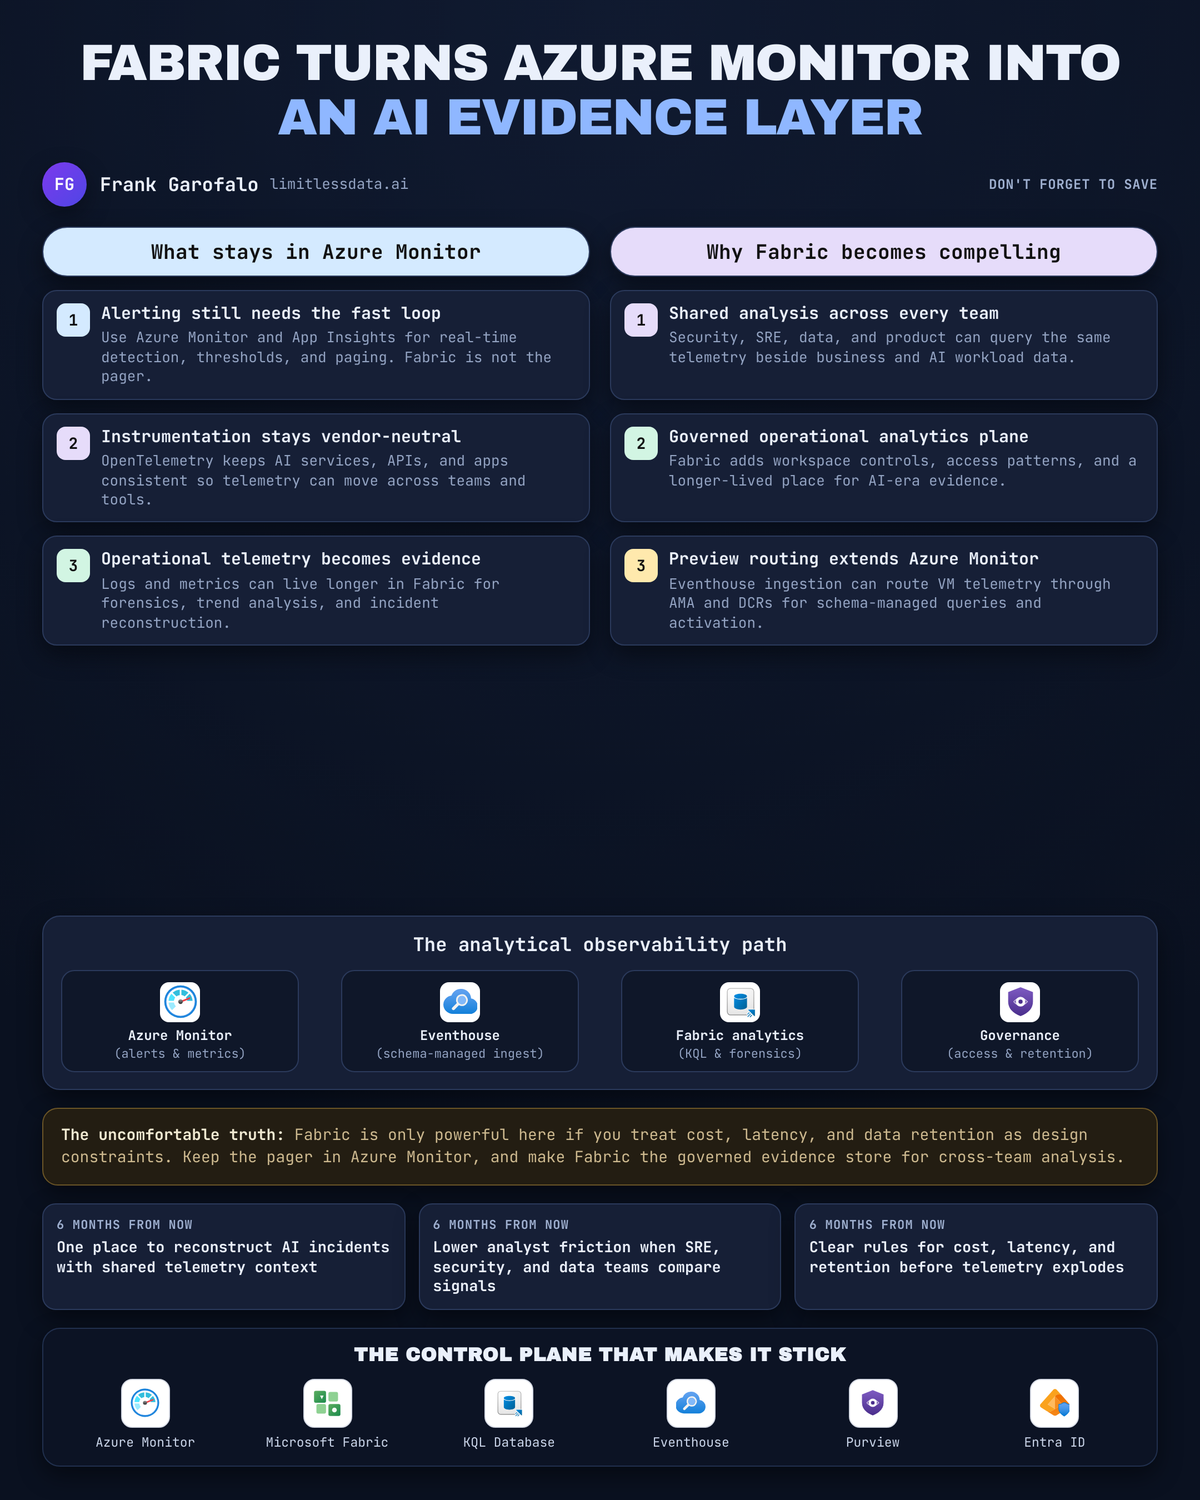
A Sev 2 last spring dragged on for 9 hours because the alert fired in the right place and the evidence lived in the wrong ones. Azure Monitor should still run the alert loop, but Fabric is where that telemetry can finally grow up into shared operational evidence.
On this page
- Azure Monitor data has outgrown the dashboard
- The architectural bet is an analytical observability plane
- Why AI workloads make the case stronger now
- Traditional monitoring tools remain essential
- The trade-offs architects need to design on purpose
- A pragmatic 90-day plan
- Fabric becomes valuable when telemetry becomes shared evidence
- Sources & References
I’m taking a hard position here: if your AI-era observability strategy ends at dashboards, you’re building for the first 15 minutes of an incident and punting on everything after that. The teams winning this right now are keeping Azure Monitor and Application Insights on point for detection and response, then using Fabric as the governed analytical layer around the exhaust.
Microsoft is lining up exactly in that direction. Fabric is positioned as a unified platform for data and analytics across the organization, not a niche sidecar for one team’s reports per the Fabric overview. And Azure Monitor Application Insights remains the right home for APM and instrumented signals, with OpenTelemetry supported for the scenarios where you want vendor-neutral instrumentation per the Application Insights overview.
Azure Monitor data has outgrown the dashboard
A lot of telemetry programs are still designed like it’s 2018: one team configures an alert, one team gets paged, one team stares at one dashboard. That model breaks the minute you put production AI, shared data products, and cross-platform dependencies into the same blast radius.
The questions change fast:
- What changed right before the failure?
- Which dependency or dataset was involved?
- Did the release ring matter?
- Is this isolated to one app tier, one model path, one capacity, or one tenant?
- What historical evidence supports the conclusion?
Dashboards are great for “something is wrong.” They are lousy at “prove what changed, show who else is affected, and preserve the evidence in a form other teams can use.”
That’s where Fabric gets interesting. Not as a replacement for Azure Monitor. Not as a vanity export destination. As the analytical observability plane where platform, app, data, AI, and operations teams can work from the same evidence base.
Last quarter I was in a war room with a 14-person platform team after a Friday release where inference latency doubled for one customer segment, and the root cause only surfaced when we joined failed requests to deployment ring metadata and a storage dependency spike that nobody had put on the main workbook.
If you want the shortest version of the architecture, it looks like this:
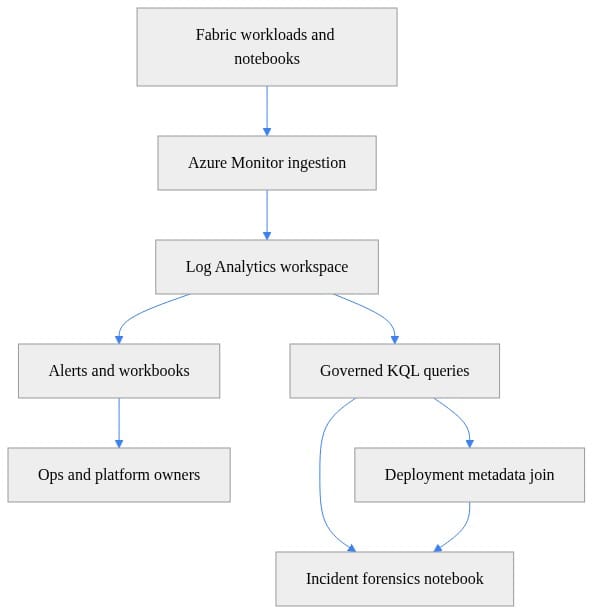
What to notice: Azure Monitor and Log Analytics still own collection, alerting, and operational workbooks. The governed query path is what extends the life of the telemetry into forensics and cross-team analysis.
The architectural bet is an analytical observability plane
The pattern I like is simple:
- Collect and operate telemetry in Azure Monitor.
- Route selected data through Azure Monitor Agent and Data Collection Rules where that fits the source.
- Land the signals you actually need for analysis in Fabric Eventhouse.
- Join them with deployment, ownership, data product, and AI workload context.
That matters because Microsoft has already exposed the direction. Azure Monitor to Fabric Eventhouse is showing up as a preview capability in Fabric’s release stream, specifically around routing VM telemetry through Azure Monitor Agent and Data Collection Rules into schema-managed ingestion with ad hoc queries, time-series analytics, and activation in Fabric What's New.
That is bigger than “another export path.” It means operational signals are being treated as first-class analytical data.
And no, that does not mean “copy everything.” That’s how people light money on fire and create a second observability mess.
Start with high-value domains:
- VM and node health for capacity-related incidents
- Application traces and failed requests
- AI service dependencies and inference paths
- Deployment events and release metadata
- Incident timelines and ownership context
A narrow proof of concept beats a giant telemetry dump every single time. In the home lab I run on Proxmox and Azure, the pattern that survives longest is always the one with explicit scope, tags, and ownership from day one. Same rule in the enterprise.
If you want a tiny POC setup, stand up a Log Analytics workspace, tag it like you mean it, and route only selected diagnostic categories. That gives you enough signal to test the operating model without pretending every metric belongs in Fabric.
# Create a resource group and Log Analytics workspace for a telemetry-routing proof of concept
param(
    [string]$SubscriptionId = "00000000-0000-0000-0000-000000000000",
    [string]$ResourceGroup = "rg-fabric-observability-poc",
    [string]$Location = "eastus",
    [string]$WorkspaceName = "law-fabric-observability-poc"
)

Connect-AzAccount | Out-Null
Set-AzContext -SubscriptionId $SubscriptionId | Out-Null
New-AzResourceGroup -Name $ResourceGroup -Location $Location -Force | Out-Null

$workspace = New-AzOperationalInsightsWorkspace `
    -ResourceGroupName $ResourceGroup `
    -Name $WorkspaceName `
    -Location $Location `
    -Sku PerGB2018

$workspace | Select-Object Name, ResourceId, Location
Run that first to create the workspace. Then tag ownership and classification so nobody has to guess whether this is a toy or an actual governed pipeline.
# Tag ownership and scope explicitly so telemetry routing has clear accountability
param(
    [string]$ResourceGroup = "rg-fabric-observability-poc",
    [string]$WorkspaceName = "law-fabric-observability-poc"
)

$workspace = Get-AzOperationalInsightsWorkspace `
    -ResourceGroupName $ResourceGroup `
    -Name $WorkspaceName

$tags = @{
    Owner = "platform-observability"
    Scope = "fabric-ai-poc"
    DataClassification = "OperationalTelemetry"
    CostCenter = "ENG-OBS"
}

Update-AzTag -ResourceId $workspace.ResourceId -Tag $tags -Operation Merge | Out-Null
Get-AzTag -ResourceId $workspace.ResourceId
What to notice: the tags are not decoration. They force accountability for owner, scope, data classification, and cost center before the telemetry starts multiplying.
Then route a deliberately narrow slice of diagnostics:
# Route selected diagnostic categories to Log Analytics with a narrowly defined proof-of-concept scope
param(
    [string]$ResourceId = "/subscriptions/00000000-0000-0000-0000-000000000000/resourceGroups/rg-fabric-observability-poc/providers/Microsoft.Storage/storageAccounts/fabricdiagpoc",
    [string]$WorkspaceResourceId = "/subscriptions/00000000-0000-0000-0000-000000000000/resourceGroups/rg-fabric-observability-poc/providers/Microsoft.OperationalInsights/workspaces/law-fabric-observability-poc"
)

$settingName = "route-selected-telemetry"
$logs = @(
    New-AzDiagnosticSettingLogSettingsObject -Enabled $true -Category "StorageRead"
    New-AzDiagnosticSettingLogSettingsObject -Enabled $true -Category "StorageWrite"
)
$metrics = @(
    New-AzDiagnosticSettingMetricSettingsObject -Enabled $true -Category "Transaction"
)

New-AzDiagnosticSetting `
    -Name $settingName `
    -ResourceId $ResourceId `
    -WorkspaceId $WorkspaceResourceId `
    -Log $logs `
    -Metric $metrics
Next step: validate the categories, volume, and query value before you add a single new source.
Why AI workloads make the case stronger now
AI operations are cross-domain by default. App behavior, prompt path, retrieval quality, model dependency, data freshness, user impact, and governance evidence all show up in the same incident whether you planned for it or not.
That’s why I think Fabric is increasingly compelling around observability. Fabric data agents are generally available and designed to make governed data more accessible through conversational Q&A systems per the Fabric data agent documentation. Fabric IQ is also clearly about building broader organizational context across domains, not just one isolated analytics surface per the Fabric IQ overview.
Put those together with telemetry and you get something useful: not an autonomous incident commander, but a governed place where operational questions can be asked against shared data.
That distinction matters. I do not want a chatbot improvising my Sev 1 response. I do want engineers, data teams, and ops leads to ask better questions over the same governed evidence.
Microsoft’s own direction reinforces this. Fabric’s release notes also call out observability for Fabric Data Agent in Microsoft Foundry as a preview item. That tells you where the pressure is building: AI systems need visibility, and that visibility has to connect to the broader data estate.
If you treat AI telemetry as isolated engineering exhaust, you’ll never create shared operational understanding. You’ll create five specialist dashboards, three conflicting incident narratives, and one executive summary held together with screenshots.
I wrote about the governance side of that in Fabric Data Agent API Just Turned Governance Into Architecture and the control-plane angle in Fabric IQ Could Become Microsoft's AI Control Plane. Same theme here: telemetry becomes valuable when more than one team can use it safely.
Traditional monitoring tools remain essential
Let me be crystal clear: Azure Monitor remains the operational system. Application Insights remains the right place for application performance monitoring and instrumented signals. OpenTelemetry remains the smart instrumentation choice when you want portability and cleaner telemetry discipline.
Fabric does not replace the alert loop.
It extends the analytical reach of selected telemetry so you can answer broader questions than a live workbook was designed for.
That means:
- on-call still works in Azure Monitor and existing incident tooling
- SecOps still runs in its established control plane
- SREs still need fast triage paths
- platform teams still need near-real-time views
- Fabric handles governed analysis, longer-lived evidence, and cross-domain joins
I’ve made this point before in Azure Monitor Must Become Your AI Decision Fabric: the issue is not whether telemetry exists. The issue is whether it can support decisions beyond the first responder.
For a lightweight query pattern, use explicit scope and time windows. That discipline matters because observability projects die when every notebook turns into a fishing expedition.
# Governed notebook setup for querying Azure Monitor with explicit scope and time window
from azure.identity import DefaultAzureCredential
from azure.monitor.query import LogsQueryClient, LogsQueryStatus
from datetime import timedelta

workspace_id = "00000000-0000-0000-0000-000000000000"
credential = DefaultAzureCredential()
client = LogsQueryClient(credential)

timespan = timedelta(hours=6)
kql = """
AppTraces
| where TimeGenerated > ago(6h)
| where SeverityLevel >= 2
| project TimeGenerated, OperationId, Message, AppRoleName
| take 20
"""

result = client.query_workspace(workspace_id, kql, timespan=timespan)
if result.status == LogsQueryStatus.SUCCESS:
    for row in result.tables[0].rows:
        print(row)
What to notice: narrow time range, explicit workspace, and a small projected shape. That’s how you keep governed analysis useful instead of noisy.
The trade-offs architects need to design on purpose
This is where people get sloppy.
1. Data duplication
Not every signal needs to move. Decide what belongs in Fabric because it answers a real analytical question. Raw high-volume telemetry without a use case is just expensive clutter.
2. Retention cost
Your retention objectives are not all the same. Alerting, forensic investigation, trend analysis, and AI evaluation evidence all have different time horizons. Design them separately.
3. Query latency
Do not promise Fabric-based analysis will replace every live troubleshooting workflow. It won’t. Near-real-time operations and exploratory historical analysis are different jobs.
4. Access boundaries
Least privilege still applies. Ops, security, data engineering, and analytics users should not all get the same access shape just because the telemetry lands in a shared platform.
5. Schema and context
This is the one that kills most efforts. If you don’t standardize correlation identifiers, workload metadata, deployment context, and ownership fields, your cross-team analytics collapses into manual guesswork.
A simple incident-forensics pattern proves the point. Join failed requests to deployment metadata and sort by time. Suddenly the conversation changes from “we think the release mattered” to “the canary ring started failing at 14:07 and every failed operation carries the same build version.”
# Correlate operational telemetry with deployment metadata for incident forensics
from azure.identity import DefaultAzureCredential
from azure.monitor.query import LogsQueryClient
from datetime import timedelta

workspace_id = "00000000-0000-0000-0000-000000000000"
client = LogsQueryClient(DefaultAzureCredential())

kql = """
let deploymentMeta = datatable(OperationId:string, DeploymentRing:string, BuildVersion:string, Owner:string)
[
  "op-1001", "prod", "2026.07.15.1", "fabric-ops",
  "op-1002", "canary", "2026.07.16.3", "ml-platform"
];
AppRequests
| where TimeGenerated > ago(2h)
| where Success == false
| project TimeGenerated, OperationId, Name, DurationMs=DurationMs, ResultCode
| join kind=leftouter deploymentMeta on OperationId
| order by TimeGenerated desc
"""

response = client.query_workspace(workspace_id, kql, timespan=timedelta(hours=2))
for row in response.tables[0].rows:
    print(dict(zip(response.tables[0].columns, row)))
What to notice: the operational value comes from the join, not the raw request table. Telemetry without context is just a louder log stream.
A pragmatic 90-day plan
If I were standing this up with a customer team right now, I’d do it in this order.
Pick one workload with repeat pain
Choose a production AI or data workload with clear owners and recurring incidents. Not ten workloads. One.
Good candidates:
- retrieval-heavy app with periodic latency spikes
- data ingestion pipeline with brittle dependencies
- model-backed internal assistant with inconsistent response quality
- shared platform service with noisy downstream impact
Define 3 investigative questions
Examples:
- Did a release correlate with latency regression?
- Which dependency pattern precedes failures?
- Are failures isolated to one model or one capacity?
- Which incidents repeat with the same ownership chain?
Route only the telemetry required
This forces discipline. If the question is about release impact, you need request failures, deployment events, and ownership metadata. You do not need every debug trace in the environment.
Measure four things
- ingestion volume
- query usefulness
- access friction
- investigation time
If those four aren’t improving, the architecture is theater.
Review the design against workload fundamentals
The Azure Well-Architected Framework is still the right backbone for this discussion because observability is not a side integration; it’s part of workload quality, operations, reliability, and decision-making per the Azure Well-Architected Framework.
For AI-heavy workloads, I also like a daily hotspot summary that groups failures and latency by model and capacity. That gives teams a sane way to separate platform pressure from app defects.
# Summarize AI-era workload hotspots by model, capacity, and failure rate
from azure.identity import DefaultAzureCredential
from azure.monitor.query import LogsQueryClient
from datetime import timedelta

client = LogsQueryClient(DefaultAzureCredential())
workspace_id = "00000000-0000-0000-0000-000000000000"

kql = """
AppDependencies
| where TimeGenerated > ago(24h)
| where Target has "model" or Name has "inference"
| extend Capacity=tostring(Properties["capacityId"]), Model=tostring(Properties["modelName"])
| summarize Calls=count(), Failures=countif(Success == false), P95=percentile(DurationMs, 95)
    by Capacity, Model
| extend FailureRate = todouble(Failures) / Calls
| order by FailureRate desc, P95 desc
"""

result = client.query_workspace(workspace_id, kql, timespan=timedelta(days=1))
print(result.tables[0].rows[:10])
What to notice: summarize first, then rank by failure rate and p95. That’s the pattern that gets engineering attention fast.
And if you need to hand incident evidence to another team, export a concise timeline instead of forwarding screenshots from three tools.
# Export a concise incident timeline from query results for downstream sharing
from azure.identity import DefaultAzureCredential
from azure.monitor.query import LogsQueryClient
from datetime import timedelta
import csv

client = LogsQueryClient(DefaultAzureCredential())
workspace_id = "00000000-0000-0000-0000-000000000000"
kql = """
AppEvents
| where TimeGenerated > ago(1h)
| where Name in ("DeploymentStarted", "DeploymentCompleted", "InferenceFailure")
| project TimeGenerated, Name, OperationId, CorrelationId, AppRoleName
| order by TimeGenerated asc
"""

result = client.query_workspace(workspace_id, kql, timespan=timedelta(hours=1))
with open("incident_timeline.csv", "w", newline="") as f:
    writer = csv.writer(f)
    writer.writerow([c.name for c in result.tables[0].columns])
    writer.writerows(result.tables[0].rows)

print("Saved incident_timeline.csv")
Next step: share the timeline with release owners, platform owners, and app leads using the same correlation IDs. That’s how you stop incident reconstruction from turning into folklore.
Fabric becomes valuable when telemetry becomes shared evidence
Here’s the judgment call.
Fabric’s opportunity in observability is not that it can ingest telemetry. Plenty of systems can ingest telemetry. Its opportunity is that it can make operational data analytically useful across organizational boundaries, alongside enterprise data and emerging AI workload signals.
That is the shift.
Keep Azure Monitor in charge of alerting, immediate response, and operational control loops. Keep your specialist tools where they are strongest. But stop treating telemetry as something that expires after the dashboard refresh.
The strongest architecture does not centralize everything. It deliberately connects alerting, incident response, analytics, governance, and AI visibility.
That’s the bar I’d use to evaluate this pattern:
- Did investigation time drop?
- Did cross-team alignment improve?
- Did incident evidence get easier to share and reuse?
- Did AI workload behavior become easier to explain?
If the answer is yes, Fabric is doing the right job around Azure Monitor.
Rate your team’s current state from 1 to 5: are you still dashboard-bound, or have you turned telemetry into governed evidence that more than one team can actually use?
#MicrosoftFabric #Azuremonitor #Observability
Sources & References
- Microsoft Fabric documentation - Microsoft Fabric
- Azure Architecture Center - Azure Architecture Center
- What is Fabric IQ? - Microsoft Fabric
- Azure Well-Architected Framework - Microsoft Azure Well-Architected Framework
- Get started with Microsoft Foundry SDKs and Endpoints - Microsoft Foundry
- Application Insights OpenTelemetry observability overview - Azure Monitor
- Fabric data agent creation - Microsoft Fabric
- Plan and Prepare to Develop AI Solutions on Azure - Training
- What's New? - Microsoft Fabric
- Microsoft Learn for Organizations
Try it yourself
Run this tutorial as a Jupyter notebook: Download runbook.ipynb (23 cells, 19 KB).