Population-Scale AI Data Strategy for Enterprise Leaders
Pathology AI is hitting population scale — and that’s the clearest case yet for data strategy before model strategy

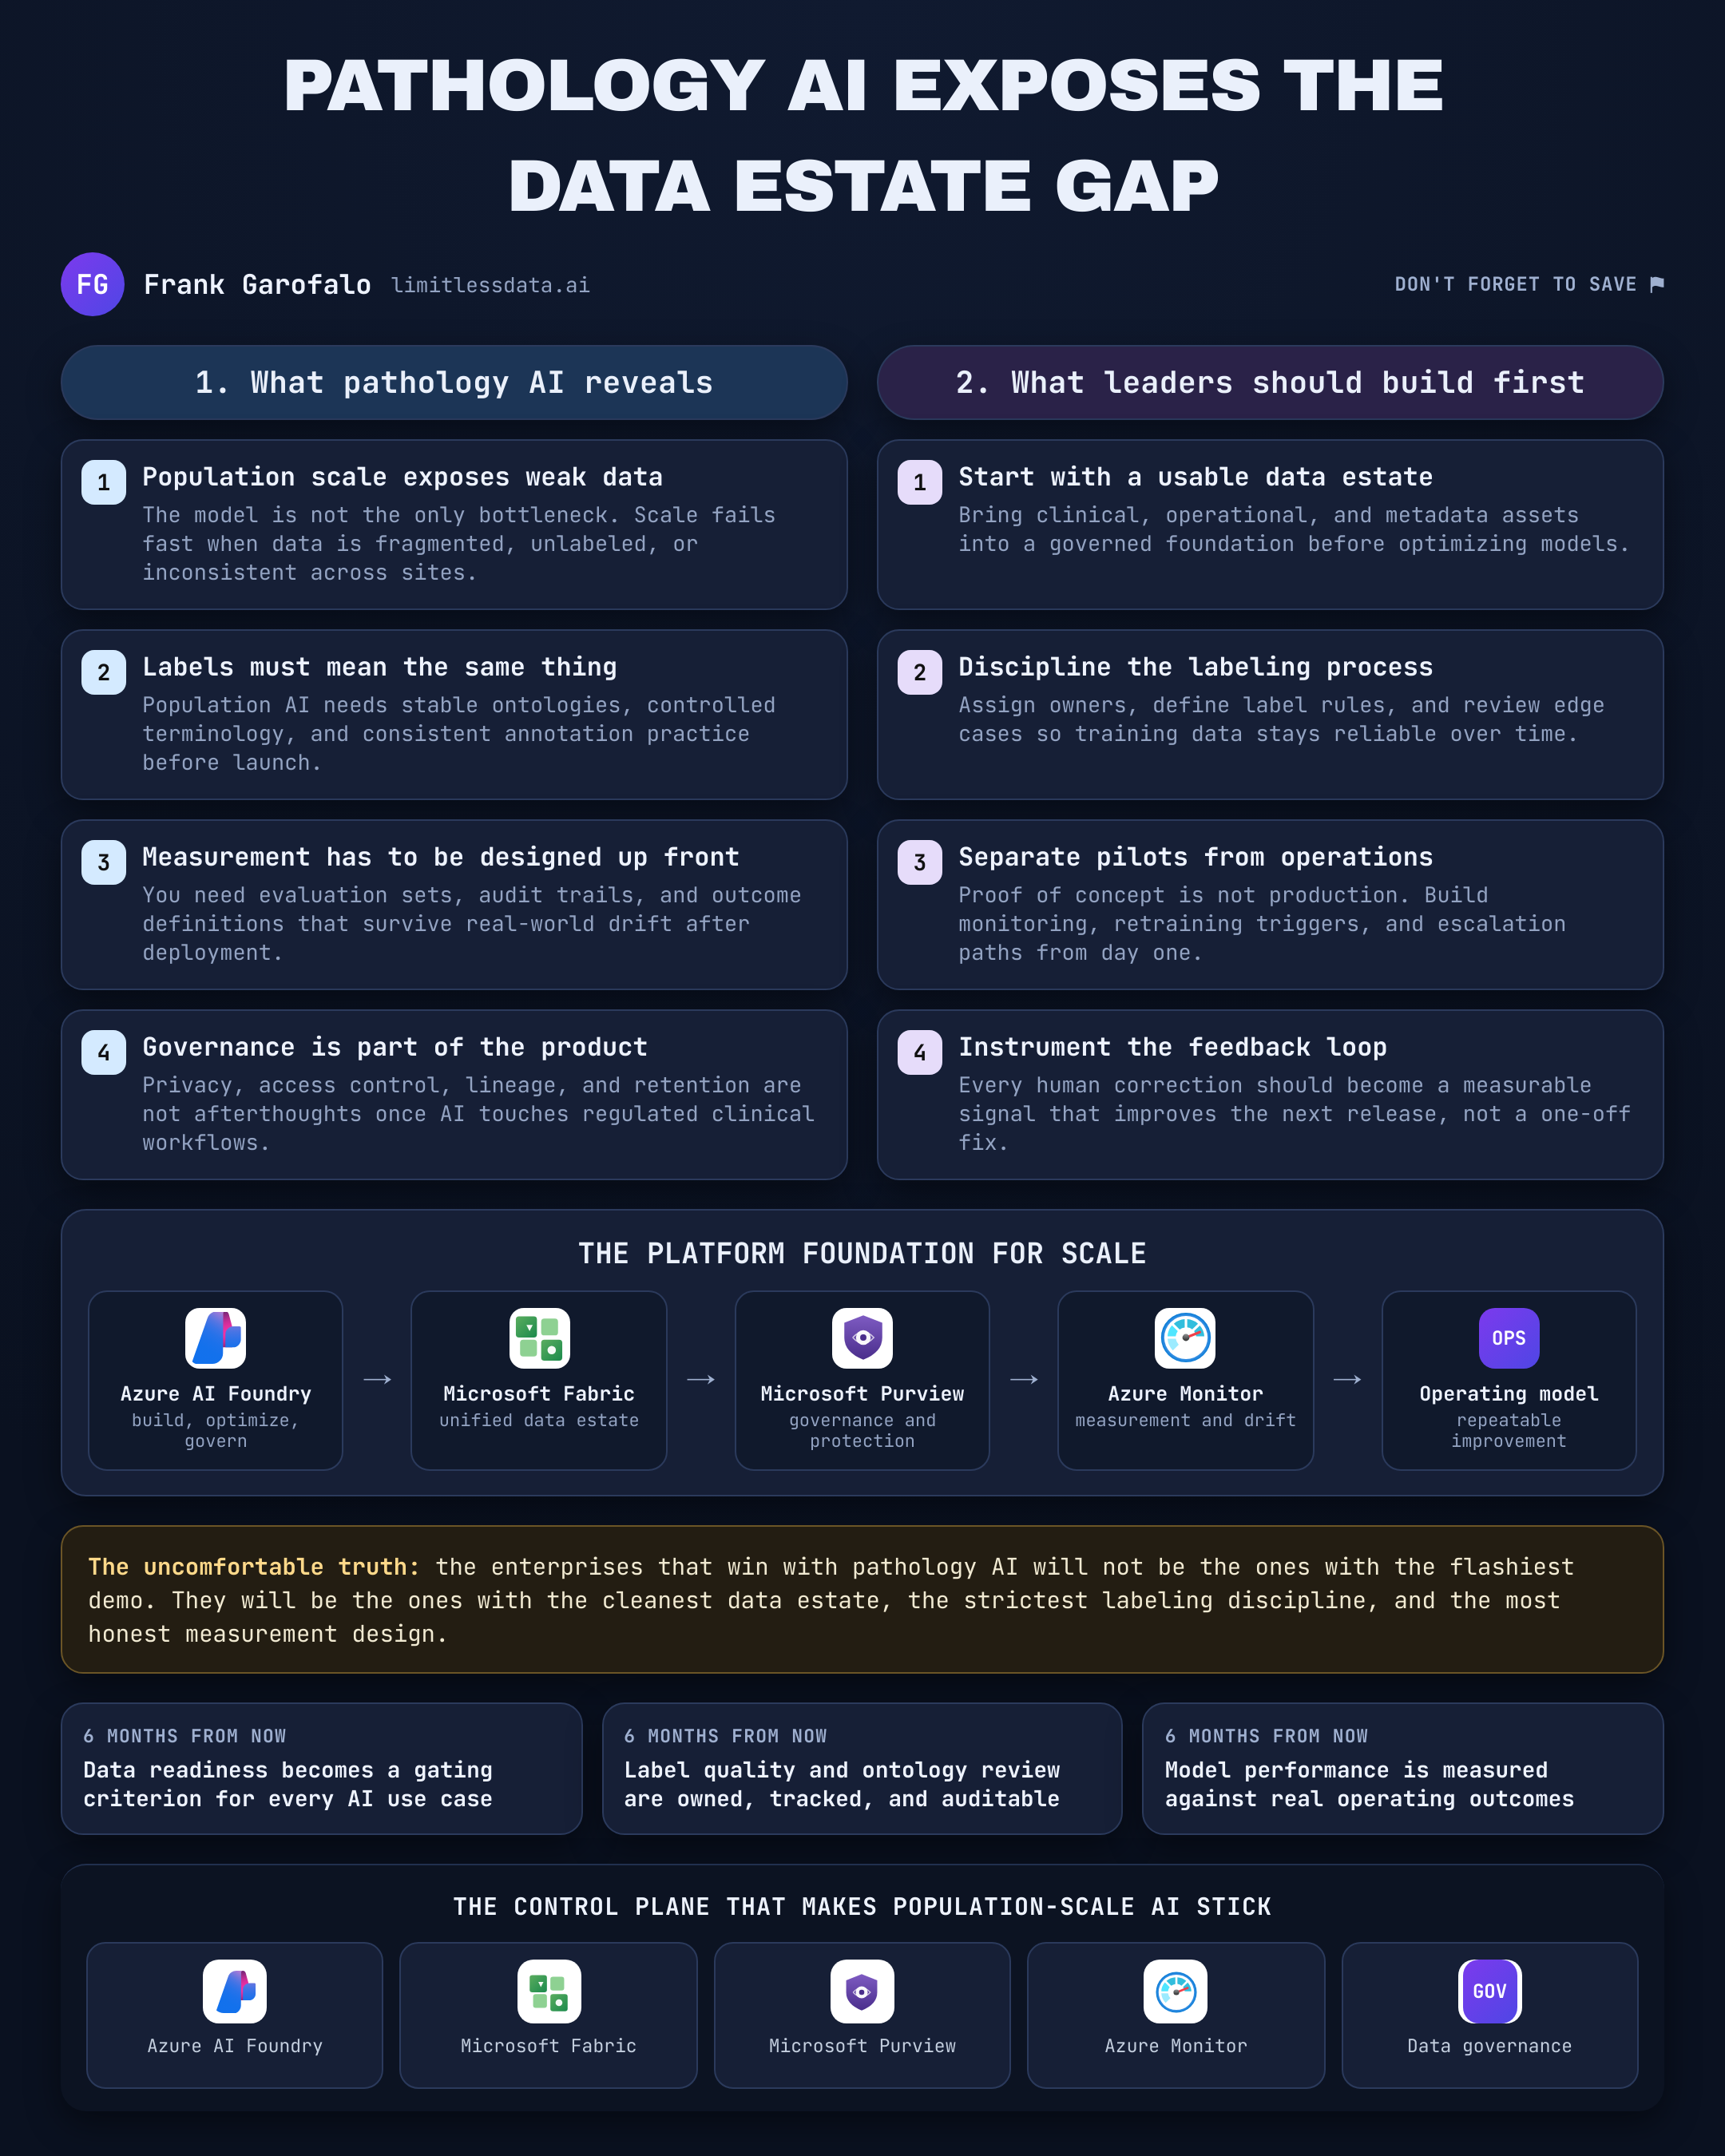
A pathology model can look brilliant on Friday and fail by Tuesday.
On this page
- Initial problem: the prototype was ahead of the operating system
- Diagnosis: population scale broke the team’s hidden assumptions
- Intervention: separate the data control plane from the model race
- Implementation: the five patterns that made the program operational
- Results: what changed when the team fixed the data estate first
- The tradeoffs executives need to understand early
- The takeaway: pathology is the clearest proof that data strategy comes first
- Code Reference
- Sources & References
Last year I was in a review with a healthcare data team that had done the part everyone likes to talk about: they had a promising pathology AI prototype, strong internal enthusiasm, and a stack of slides showing benchmark performance. Then we pulled one ugly thread. Site A called the stain one thing, Site B called it three things, scanner metadata was free text, and a meaningful share of the pilot cohort had no usable diagnosis label at all. The model wasn’t the bottleneck. The data estate was.
That’s why pathology is such a useful frontier signal right now. When domain AI starts pushing toward population scale, the conversation moves fast from “how smart is the model?” to “can this organization repeatedly feed, govern, evaluate, and improve this thing across heterogeneous real-world operations?”
And that lesson travels well beyond healthcare.
I’m using one healthcare data team’s pathology program as the case study here because it makes the failure modes obvious: huge image payloads, messy metadata, uneven labels, site-specific workflows, and real consequences when evaluation design is sloppy. The same pattern shows up in manufacturing, banking, retail, and every other domain where leaders want AI to behave like an operating capability instead of a hackathon trophy.
Initial problem: the prototype was ahead of the operating system
The strategic shift is straightforward. Domain AI becomes consequential when it can be applied repeatedly across large, messy populations, not when it wins on a narrow benchmark.
That’s why the pathology frontier matters. Teams are now aiming at enterprise-scale workflows, not isolated experiments. Microsoft’s platform story lines up with that reality: Fabric is positioned as a unified platform for organizational data and analytics needs per the Microsoft Fabric docs, Purview is positioned around governing, protecting, and managing data wherever it lives per the Microsoft Purview docs, and Foundry is framed as a place to build, optimize, and manage AI apps and agents at scale per the Azure AI Foundry docs.
But in this pathology scenario, the issue was not model ambition. It was sequencing.
The team had:
- a prototype model with encouraging benchmark slides
- inconsistent site and scanner metadata
- weak label discipline across cohorts
- evaluation sets that did not fully reflect deployment conditions
- no reliable release packet tying lineage, subgroup performance, and QC decisions together
If you skip data readiness, your “production AI strategy” turns into a very expensive metadata cleanup project done under deadline pressure.
I’ve written before about clinical AI platform readiness for healthcare leaders. Pathology is the same lesson with sharper edges: if you can’t trust the source data, labels, and evaluation population, you can’t trust the deployment.
Diagnosis: population scale broke the team’s hidden assumptions
A small pilot lets teams get away with murder.
You can hand-fix metadata. You can let one pathologist settle label disputes informally. You can tolerate missing lineage because everyone still remembers where the files came from. You can celebrate one test-set score and pretend it represents reality.
Population scale kills all of that.
As the dataset grew, four problems compounded:
- Input heterogeneity exploded
Different scanners, different sites, different stain naming conventions, different capture practices.
- Metadata quality decayed
Free-text fields, missing values, inconsistent units, local abbreviations.
- Label quality drifted
Definitions changed, adjudication varied, exceptions piled up, and nobody versioned the ontology.
- Evaluation got gamed by accident
Patient leakage, site imbalance, scanner skew, and benchmark sets that didn’t resemble the deployment population.
Here’s the blunt version: a strong model sitting on top of weak contracts is still a weak production system.
Fabric’s own training material explicitly ties together integrating, transforming, and storing data to train AI models and create reports in one flow per the Fabric training path. Good. That’s the right shape. But tools don’t rescue teams from bad operating discipline.
Intervention: separate the data control plane from the model race
The turning point came when leadership stopped treating the model as the product.
The product was the operating capability:
- governed source ingestion
- normalized metadata
- quality gates
- stable labels
- representative evaluation
- release decisions with accountability
- monitoring after launch
When I’m helping a team reset around this, I draw the architecture in two lanes.
Lane 1 is the data control plane:
- source systems and instruments
- de-identification
- schema normalization
- quality checks
- provenance
- label management
- evaluation assets
- governance and access control
Lane 2 is the model race:
- training
- tuning
- inference packaging
- application integration
- release
- monitoring
The mistake is letting Lane 2 outrun Lane 1.
This simple flow is how I explain it to executives and engineering leads in the same room:
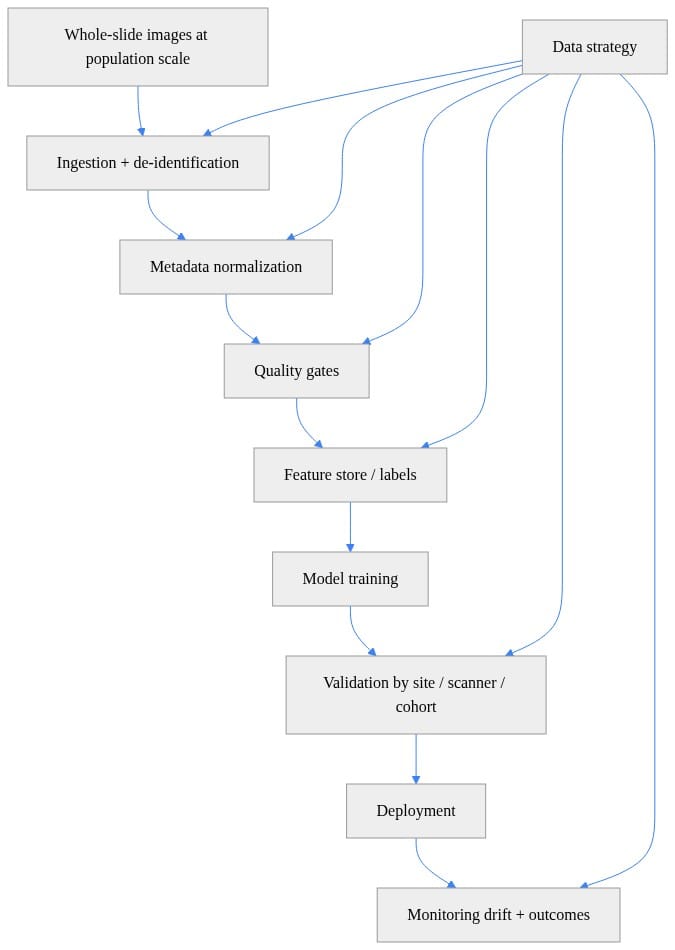
What to notice: data strategy touches ingestion, normalization, QC, labels, evaluation, and monitoring. That’s the entire life cycle, not a pre-work task.
Implementation: the five patterns that made the program operational
Here’s the practical part. In this pathology program, the recovery plan centered on five implementation patterns.
1) Define a metadata contract before training anything
If your slide records don’t have stable fields for site, scanner, stain, magnification, and diagnosis label status, you do not have a training asset. You have a file pile.
This is the minimum muscle memory I want teams to build first:
# Build a pathology metadata contract before training any model
from dataclasses import dataclass, asdict
import json

@dataclass
class SlideRecord:
    slide_id: str
    patient_id_hash: str
    site: str
    scanner_vendor: str
    stain: str
    magnification: int
    diagnosis_label: str | None

record = SlideRecord(
    slide_id="WSI-0001",
    patient_id_hash="sha256:9f3c...",
    site="Hospital-A",
    scanner_vendor="Aperio",
    stain="H&E",
    magnification=40,
    diagnosis_label=None,
)

print(json.dumps(asdict(record), indent=2))
What to observe: the contract is boring on purpose. That’s the point. Production AI dies in boring fields long before it dies in transformer architecture.
In enterprise delivery, I want every field to answer one of three questions:
- can I route it?
- can I evaluate with it?
- can I govern access to it?
If the answer is no to all three, it probably doesn’t belong in the first contract.
2) Normalize metadata aggressively
Hidden cohort fragmentation is one of the nastiest path-to-production problems in domain AI. “Aperio XT,” “aperio,” and “Aperio ScanScope” are not three useful cohorts. They’re one vendor family masquerading as three categories because nobody imposed control.
I’ve seen teams lose two weeks debugging “generalization issues” that were really taxonomy sloppiness.
Use a normalization layer early:
# Normalize scanner and stain metadata to reduce hidden cohort fragmentation
from collections import Counter

slides = [
    {"scanner": "Aperio XT", "stain": "H&E"},
    {"scanner": "aperio", "stain": "H and E"},
    {"scanner": "Hamamatsu", "stain": "HE"},
]

scanner_map = {"aperio xt": "Aperio", "aperio": "Aperio", "hamamatsu": "Hamamatsu"}
stain_map = {"h&e": "H&E", "h and e": "H&E", "he": "H&E"}

normalized = []
for s in slides:
    normalized.append({
        "scanner": scanner_map[s["scanner"].strip().lower()],
        "stain": stain_map[s["stain"].strip().lower()],
    })

print(normalized)
print(Counter((x["scanner"], x["stain"]) for x in normalized))
What to observe: this is not glamorous work, but it directly affects your cohort inventory, your split strategy, and your drift monitoring later.
This is also where a unified analytics layer pays off. Fabric is useful here because the integration, transformation, and storage work can live in one operating surface instead of being scattered across disconnected tools. I covered the operating model side of that in AI-Native Data Engineering Operating Model With Fabric.
3) Fail bad slides fast with explicit quality gates
A lot of teams poison training with junk because they don’t want to “throw away scarce data.” That sounds responsible until you realize they’re teaching the model on blur, low tissue coverage, and inconsistent resolution.
Quality gates are not optional at population scale.
# Add quality gates so bad slides fail fast before they poison training
def qc_slide(width: int, height: int, blur_score: float, tissue_pct: float) -> dict:
    checks = {
        "min_resolution": width >= 5000 and height >= 5000,
        "focus_ok": blur_score >= 0.65,
        "enough_tissue": tissue_pct >= 0.20,
    }
    checks["pass"] = all(checks.values())
    return checks

result = qc_slide(width=8000, height=6000, blur_score=0.72, tissue_pct=0.34)
for k, v in result.items():
    print(f"{k}: {v}")
What to observe: you want deterministic checks with reasons. “Pass/fail” alone is useless. You need auditability so data stewards and domain SMEs can improve upstream capture practices.
My rule: if you can’t explain why a sample was included, excluded, or relabeled, you can’t defend the model release.
4) Split by the real deployment boundary, not convenience
This is where a lot of benchmark glory goes to die.
If your train/test split leaks patients, sites, scanners, or collection patterns, the metric is inflated. Full stop.
For pathology, I care a lot more about generalization across sites and operational conditions than I do about one pretty aggregate number.
# Split by patient and site to measure generalization instead of memorization
from collections import defaultdict

rows = [
    {"patient": "P1", "site": "A"}, {"patient": "P2", "site": "A"},
    {"patient": "P3", "site": "B"}, {"patient": "P4", "site": "B"},
    {"patient": "P5", "site": "C"},
]

splits = defaultdict(list)
for row in rows:
    target = "test" if row["site"] == "C" else "train"
    splits[target].append(row["patient"])

print("train_patients:", sorted(set(splits["train"])))
print("test_patients:", sorted(set(splits["test"])))
What to observe: the split logic should mirror deployment risk. If you expect the model to face a new site or scanner profile in production, your evaluation set should force that condition now. This snippet is a conceptual pattern, not a production-ready splitting framework for regulated or high-stakes environments.
Then report subgroup metrics, not just the average:
# Report metrics by subgroup because average accuracy hides deployment risk
metrics = {
    ("Site-A", "Aperio"): 0.93,
    ("Site-B", "Hamamatsu"): 0.81,
    ("Site-C", "Aperio"): 0.88,
}

overall = sum(metrics.values()) / len(metrics)
print(f"overall_auc={overall:.2f}")

for (site, scanner), auc in sorted(metrics.items()):
    flag = "CHECK" if auc < 0.85 else "OK"
    print(f"{site} | {scanner} | auc={auc:.2f} | {flag}")
What to observe: an overall AUC can look healthy while one site-scanner subgroup is underwater. That’s exactly how bad releases happen.
This same idea shows up in agent systems too. I made the same point from a different angle in Azure Agent Resilience Testing for Production Readiness: average performance hides operational failure modes.
5) Monitor metadata drift before you obsess over model drift
Teams love fancy output monitoring dashboards. Good. Build them. But start with metadata drift because it often explains the output shift faster.
If your scanner mix changes from 70/30 to 45/55, or one site suddenly dominates the incoming population, your model behavior may degrade even if nothing changed in the code.
# Monitor production drift on metadata first, not just model outputs
baseline = {"Aperio": 0.70, "Hamamatsu": 0.30}
current = {"Aperio": 0.45, "Hamamatsu": 0.55}

for key in sorted(set(baseline) | set(current)):
    b = baseline.get(key, 0.0)
    c = current.get(key, 0.0)
    delta = c - b
    status = "ALERT" if abs(delta) > 0.20 else "OK"
    print(f"{key}: baseline={b:.2f}, current={c:.2f}, delta={delta:+.2f}, {status}")
What to observe: this is the early-warning system. It gives you something operational teams can act on before a clinical or business stakeholder reports a problem downstream. This example is intentionally simple; production drift monitoring needs stronger thresholds, lineage, alert routing, and investigation workflows.
Results: what changed when the team fixed the data estate first
Let me put numbers on this carefully, because “governance” without operational evidence is just conference talk.
In one anonymized internal pathology-style workflow redesign I advised, the team stopped tuning the model for several weeks and put the effort into contracts, normalization, QC, and split discipline. The outcomes below are internal program indicators from that engagement, not externally verified benchmarks:
- required metadata fields became materially more complete and usable for routing and evaluation
- unlabeled or unusable records in the active training pool fell meaningfully after contract enforcement and label review
- QC rejection reasons became explicit, which reduced accidental ingestion of bad samples into training
- evaluation became faster because cohorts were pre-normalized instead of hand-fixed in notebooks
- release review became easier because lineage and subgroup metrics were packaged together
- the gap between headline aggregate performance and worst subgroup performance narrowed, which made the system safer to operate
That last point is the one I care about most. It means the system got safer to run, not just prettier to present.
And the organizational outcome mattered just as much: the AI team stopped arguing every week about which model family to bet on and started operating a repeatable release process.
That’s the real maturity jump.
The tradeoffs executives need to understand early
You do pay for this discipline.
You will slow down the first demo. You will spend money on label operations. You will force business units to give up local definitions. You will make some teams angry by rejecting data they thought was “good enough.”
Good. That’s the cost of turning AI into infrastructure.
A few tradeoffs I’d call out directly:
Central control vs local expertise
You need central standards for contracts, ontology versioning, access policy, and evaluation criteria. But label adjudication still needs domain experts close to the workflow.
Unified platform vs tool sprawl
A unified platform helps reduce handoff friction. Fabric can play that role on the data and analytics side, Purview can anchor governance, and Azure AI Foundry can support building and managing AI applications. But platform selection is downstream of operating model clarity, not a substitute for it.
Speed vs defensibility
The fastest path to a prototype is usually the slowest path to a defendable production rollout.
Model-first procurement vs release accountability
Buying a capable model or AI platform early feels decisive. In practice, it often creates pressure to deploy before the organization has defined acceptance thresholds, ownership, and rollback criteria.
I’ve also seen teams underestimate the governance layer. Purview matters here because AI scale breaks fast when nobody can answer basic questions about where sensitive data lives, who can access it, and which version fed a release. I hit that theme hard in Fabric Data Protection Decides Who Survives AI Scale.
The takeaway: pathology is the clearest proof that data strategy comes first
Pathology is a frontier signal because it strips away the fantasy that better models erase weak operations.
They don’t.
As domain models get more capable and more efficient, the value of enterprise readiness goes up, not down. The winners will be the organizations that can do five things reliably:
- define governed domain data products
- maintain stable ontologies and labels
- evaluate on the real deployment population
- preserve lineage from output back to source and release decision
- run post-launch monitoring with accountable owners
If you’re building for population scale, the sequencing is simple:
- inventory the decision you want AI to support
- map the source data, labels, owners, and constraints
- create a governed, measurable, label-ready data estate
- define evaluation and release rules
- then compete on model choice
That’s the lesson from pathology. It also happens to be the lesson from every serious enterprise AI program I’ve seen survive contact with production.
Rate your team’s current state on one specific capability from this case study — metadata contracts, label discipline, subgroup evaluation, or drift monitoring — from 1 to 5.
Which one usually breaks first in your environment?
#EnterpriseAI #DataArchitecture #HealthcareAI
Code Reference
Additional code samples that complement the tutorial above.
Sample 1 (powershell)
# Enforce a folder convention so downstream pipelines can trust the data layout
$root = "C:\pathology-data"
$required = @("raw", "deid", "metadata", "qc", "labels", "splits")

foreach ($name in $required) {
    $path = Join-Path $root $name
    if (-not (Test-Path $path)) {
        New-Item -ItemType Directory -Path $path | Out-Null
    }
}

Get-ChildItem $root -Directory | Select-Object Name, FullName
Sample 2 (mermaid)
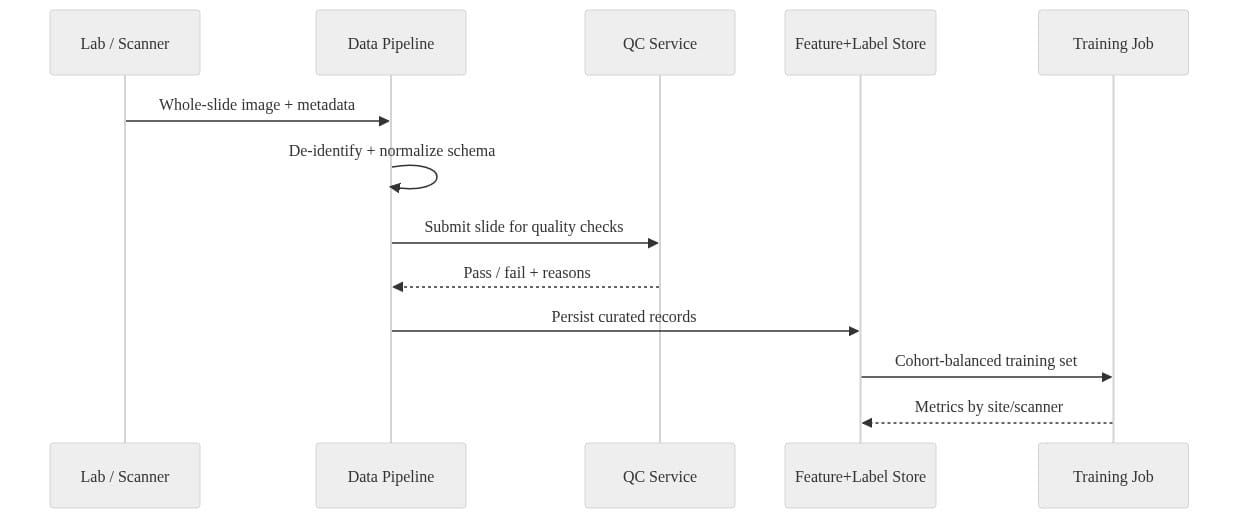
Sample 3 (powershell)
# Compute a simple cohort inventory to expose imbalance before model selection
$data = @(
    [pscustomobject]@{ Site = "A"; Scanner = "Aperio"; Label = "Positive" }
    [pscustomobject]@{ Site = "A"; Scanner = "Aperio"; Label = "Negative" }
    [pscustomobject]@{ Site = "B"; Scanner = "Hamamatsu"; Label = "Positive" }
    [pscustomobject]@{ Site = "C"; Scanner = "Aperio"; Label = "Negative" }
)

$data |
    Group-Object Site, Scanner, Label |
    Select-Object @{n="Cohort";e={$_.Name}}, Count |
    Sort-Object Cohort |
    Format-Table -AutoSize
Sources & References
- Microsoft Foundry documentation
- Microsoft Fabric documentation - Microsoft Fabric
- Learn about Microsoft Purview
- Get started with Microsoft Fabric - Training
Try it yourself
Run this tutorial as a Jupyter notebook: Download runbook.ipynb (37 cells, 30 KB).